
Epi Data Brief

June 2026, No. 159

Mental Health Inequities among Asian New Yorkers

New York City (NYC) is home to one of the largest Asian populations in the U.S., with over 1.5 million Asian residents, representing 17.3% of the city’s population.1 Nearly half of Asian New Yorkers identify their ancestry as Chinese, with Indian, Korean, Filipino, Bangladeshi, Pakistani, and Japanese ancestries also representing substantial shares of the Asian population.2 These communities are diverse in their immigration histories, languages, and socioeconomic factors. They also face unique structural challenges, including anti-Asian racism and inequitable access to affordable, culturally responsive care, that contribute to mental health inequities.3

Although Asian New Yorkers make up a significant portion of the NYC population, they are often underrepresented in public health research,3 a form of structural exclusion that renders community-specific health needs invisible and undermines the development of equitable policies and services. Asian adult New Yorkers report a lower rate of serious psychological distress (SPD) and are less likely to receive mental health treatment when experiencing SPD compared with adults of other races and ethnicities.4 These patterns may partly reflect the model minority stereotype, which can suppress help-seeking, contribute to underreporting, and mask significant disparities within Asian communities. Understanding how mental health outcomes and help-seeking differ by Asian ancestries is critical for identifying unmet needs and informing culturally and linguistically responsive interventions.3,5

This data brief examines SPD, social isolation, seeking help for mental health, receipt of mental health treatment, and unmet mental health treatment needs among Asian New Yorkers, across three Asian regions and ten Asian ancestries. Ancestry refers to an individual’s self-reported ethnic or cultural background, which may be different from their country of birth.

In New York City, serious psychological distress varies across Asian regions
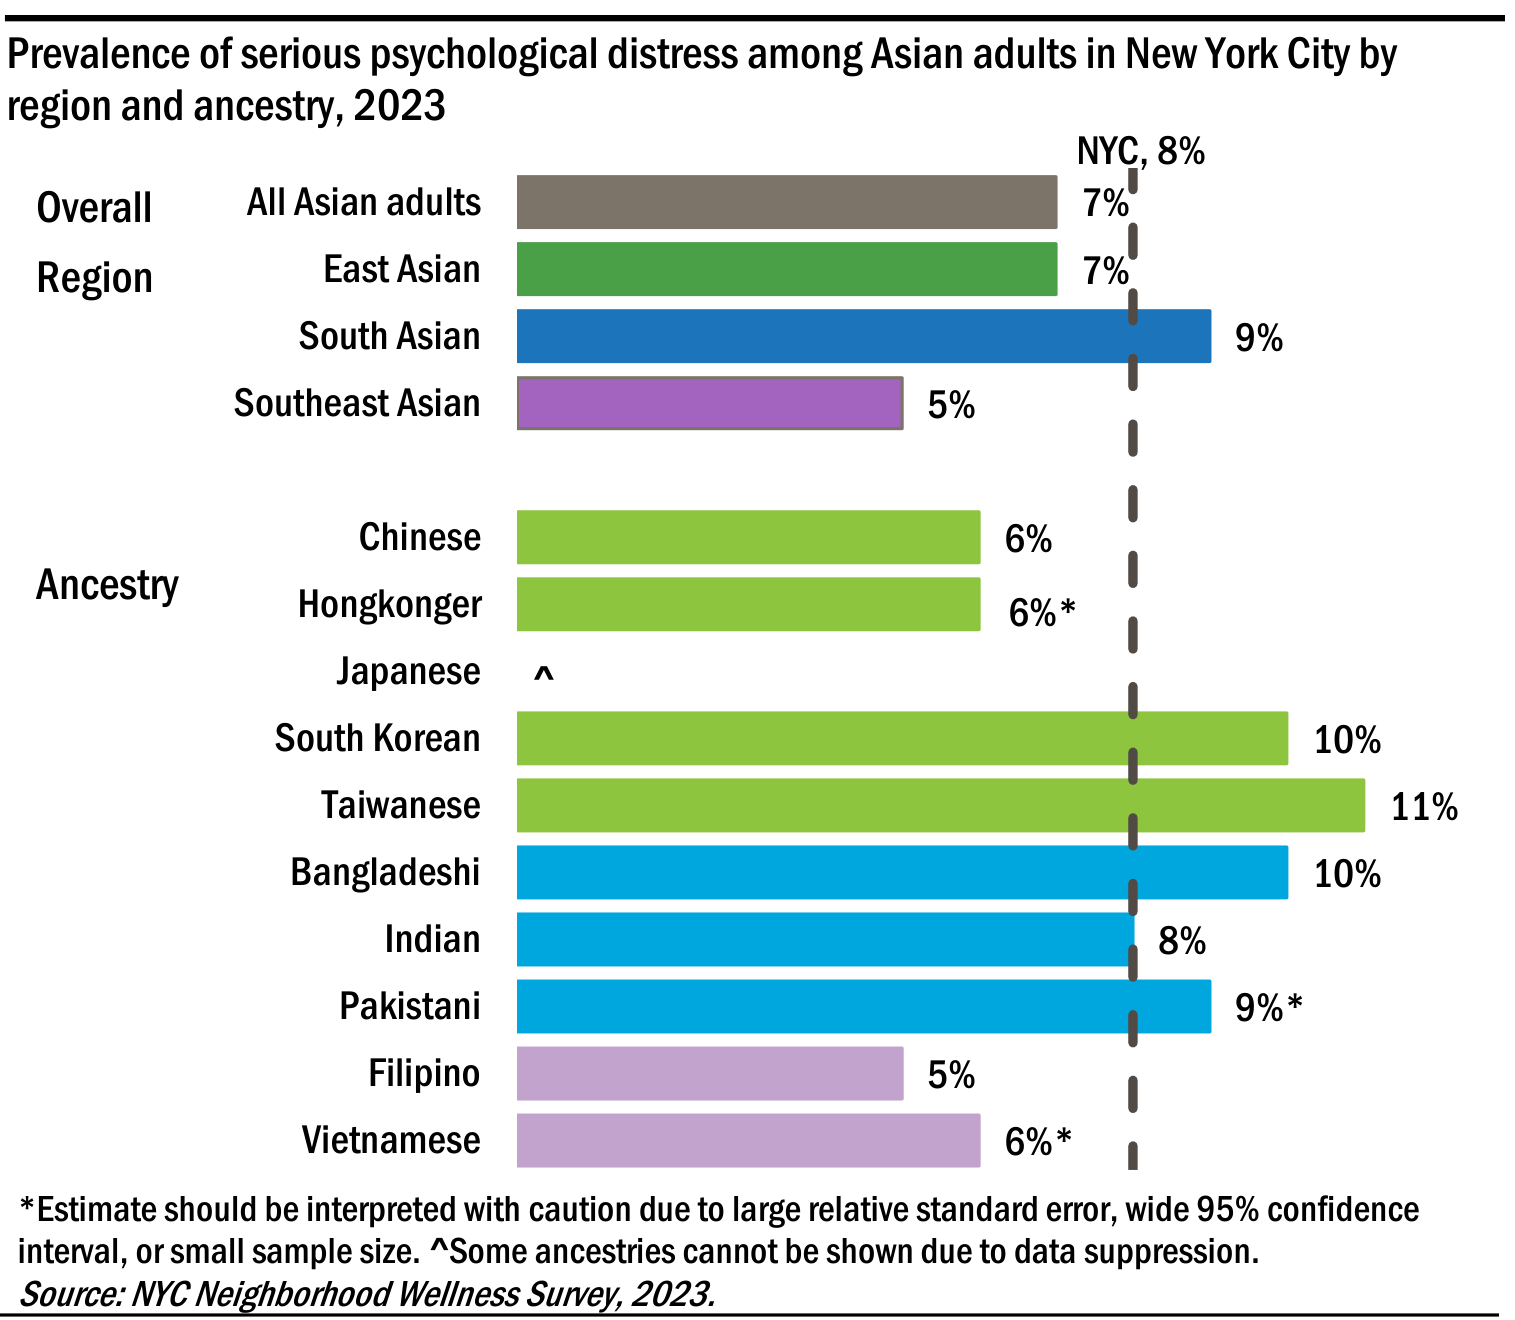
Prevalence of serious psychological distress among Asian adults in New York City by region and ancestry, 2023
View chart full size
Chart data, notes, and source
GroupEstimate
NYC8%
All Asian adults7%
East Asian7%
South Asian9%
Southeast Asian5%
Chinese6%
Hongkonger6%*
Japanese^
South Korean10%
Taiwanese11%
Bangladeshi10%
Indian8%
Pakistani9%*
Filipino5%
Vietnamese6%*

*Estimate should be interpreted with caution due to large relative standard error, wide 95% confidence interval, or small sample size. ^Some ancestries cannot be shown due to data suppression.

Source: NYC Neighborhood Wellness Survey, 2023.

  • In 2023, an estimated 81,000 (7%) NYC Asian adults experienced SPD in the past 30 days, a prevalence lower than Latino (10%), Middle Eastern or North African (12%), and multiracial (13%) adults, but similar to white (7%) and Black (8%) adults.
  • Within Asian regions, South Asian adults (9%) had a higher prevalence of SPD compared with East Asian (7%) and Southeast Asian adults (5%).
  • Among ancestry groups, Bangladeshi adults had a higher prevalence of SPD compared with Chinese adults (10% vs. 6%).


While overall the prevalence of social isolation is similar across Asian regional groups, Taiwanese adults have the highest prevalence of social isolation among Asian ancestries

  • Social isolation in the past 30 days affected an estimated 406,000 NYC Asian adults (37%), a prevalence lower than that among Black (42%), Latino (43%), Middle Eastern and North African (43%), and multiracial (47%) adults, and similar to white adults in NYC.
  • The prevalence of social isolation was similar across all regional groups. However, among ancestry groups, Taiwanese adults had a higher prevalence of social isolation (47%) than Chinese (37%), Bangladeshi (36%), Vietnamese (35%), Indian (34%), and Filipino (34%) adults, and Hongkongers (32%*).
  • Among Asian adults who experienced social isolation, 17% also experienced SPD, with a higher rate among South Asian adults compared with East Asian adults (21% vs. 16%).

Prevalence of social isolation by Asian region and ancestry among Asian adults in New York City, 2023

Asian region

All Asian adults 37%
East Asian 37%
South Asian 36%
Southeast Asian 36%

Ancestry

Chinese 37%
Hongkongers 32%*
Japanese 37%
South Korean 41%*
Taiwanese 47%*
Bangladeshi 36%
Pakistani 40%
Indian 34%
Filipino 34%
Vietnamese 35%

Note: Error bars represent 95% confidence intervals. An asterisk (*) indicates the estimate is statistically significantly different from that of all Asian adults.

Source: NYC Community Health Survey, 2023.

Asian adults with serious psychological distress are less likely to seek mental health support than other NYC adults, with family or friends being the most common source of support

  • Asian adults with SPD were less likely to have sought mental health support in the past 12 months (64%) than Latino (73%), Middle Eastern or North African (83%*), white (77%), and multiracial (78%*) adults with SPD. The prevalence of seeking mental health support was similar across adults from Asian regions.
  • Among Asian adults with SPD, the most common support sought was from family or friends (43%), followed by therapists or counselors (22%), psychiatrists or other prescribers of medication (18%), and primary care doctors (15%), with no differences observed across regions.

Definitions: Race and ethnicity: For the purpose of this publication, Latino includes people of Hispanic or Latino origin, as identified by the survey question “Are you Hispanic or Latino?” and regardless of reported race. Asian, Black, Middle Eastern or North African, multiracial, white, and other race categories exclude those who identified as Latino.

Asian adults include those who self-identified as a single race of Asian, excluding multiracial individuals, individuals of Hispanic or Latino ethnicity, and Native Hawaiians and other Pacific Islanders, to reflect distinct demographic characteristics and health needs. Asian heritage or ancestry is self-reported and based on the question: “What is your ancestry or ethnic origin?” Although captured in two variables, priority was given to the first-reported ancestry for this analysis, resulting in relatively few individuals classified as having mixed Asian ancestry. Ancestry questions were used to create ancestry groups by Asian region: East Asia includes China, Hong Kong, Japan, South Korea, Mongolia, Taiwan, and Tibet. South Asia includes Afghanistan, Bangladesh, India, Iran, Nepal, Pakistan, and Sri Lanka. Southeast Asia is comprised of Cambodia, Indonesia, Laos, Malaysia, Myanmar, Philippines, Singapore, Thailand, and Vietnam. Only Asian ancestry groups with adequate sample sizes (n>=50) are shown.

Serious Psychological Distress (SPD) is defined as having a score greater than or equal to 13 on the Kessler 6 (K6) scale, a six-item scale developed to identify people highly likely to have a diagnosable mental illness and associated functional limitations. Using a five-point scale from “all of the time” to “none of the time,” survey respondents were asked to rate the frequency of six symptoms of mental illness or nonspecific psychological distress: “During the past 30 days, how often did you feel … 1. So sad or depressed that nothing could cheer you up; 2. Nervous; 3. Hopeless; 4. Restless or fidgety; 5. That everything was an effort; 6. Worthless.

Social Isolation: feeling distant or cut off from others somewhat or a lot in the past 30 days.

Mental health support comes from both informal sources (e.g., family or friends) and formal sources (e.g., therapist/counselor, primary care doctor).

Among those with serious psychological distress, prevalence of receiving mental health counseling or medication varies across Asian ancestries

  • Overall, in NYC, over a third (39%) of Asian adults with SPD in the past 30 days received mental health treatment (either counseling or medication) in the past 12 months, a lower proportion than all other race and ethnicity groups, including American Indian or Alaska Native (67%*), Black (48%), Latino (54%), Middle Eastern or North African (56%*), white (58%), and multiracial (55%*) adults.
  • About 42% of Chinese adults with SPD received mental health treatment, a lower prevalence than among Japanese adults (70%*) but higher than among Bangladeshi (25%*) and Taiwanese (27%*) adults.

Costs are the most commonly cited barrier to accessing mental health care among Asian adults with serious psychological distress in New York City

Barriers to mental health treatment among Asian adults with serious psychological distress and who reported an unmet need for mental health treatment, New York City, 2023
Could not afford cost of treatment
54%*
Thought could handle mental health without treatment
48%
Didn’t know who to contact or where to go
43%
Worried that if I got mental health treatment people would think badly of me
31%
Hours or locations were not convenient
27%
*Estimate should be interpreted with caution due to large relative standard error, wide 95% confidence interval, or small sample size. Source: NYC Neighborhood Wellness Survey, 2023
  • Among Asian adults with SPD that reported unmet need for mental health treatment, more than half (54%*) reported cost as a main barrier to accessing mental health care. Other common barriers included the belief that they could handle their mental health on their own (48%), not knowing where to go or who to contact (43%), concern about stigma (31%), or inconvenient hours or locations (27%).

*Estimate should be interpreted with caution due to large relative standard error, wide 95% confidence interval, or small sample size.

Definitions (cont.): Unmet mental health treatment need is defined as answering “yes” to the question: In the past 12 months, was there a time when you needed treatment (either counseling or medication) for your emotions, nerves, or mental health, but did not get it?

Authors: Thinh Toan Vu, Jo-Anne Caton, Melanie Close, Liza King, Christina Norman

Acknowledgements: Kinjia Hinterland, Sungwoo Lim, Gretchen Van Wye, Mamta Parakh, Ellenie Tuazon, Jamie Neckles, Jorge Petit, Adrienne Verrilli, William D. Fowler, Chantal Gomez, Rachel Vick, Maura Kennelly

Data Source: The NYC Neighborhood Wellness Survey (NWS) 2023, conducted May to September 2023, was a collaboration between the Health Department and the City University of New York (CUNY) Graduate School of Public Health and Health Policy. The NWS used a probability-based approach using address-based sampling methods to randomly sample among non-institutionalized adults ages 18 and older. Most surveys were completed by mail with some online completion. Estimates are age-adjusted to the U.S. 2000 standard population and weighted to the adult residential population per the American Community Survey, 2021.

Health equity is attainment of the highest level of health and well-being for all people. Not all New Yorkers have the same opportunities to live a healthy life. Achieving health equity requires focused and ongoing societal efforts to address historical and contemporary injustices such as discrimination based on race/ethnicity, and other identities. For more information, visit the World Health Organization’s Health Equity webpage.

Implications

Overall, Asian New Yorkers report more favorable mental health outcomes compared with adults of other racial and ethnic groups. These patterns may partly reflect protective factors such as strong social networks and community cohesion.3 However, these differences should be interpreted with caution, as stigma and the model minority stereotype may influence how mental health is perceived, reported, and addressed. Further, examining Asian adults as a homogenous group obscures meaningful differences among Asian ancestries. Our findings reveal substantial heterogeneity within Asian communities, highlighting the importance of examining within-race differences in mental health outcomes. For example, South Asian adults experience higher prevalence of SPD than adults from other Asian regions. Taiwanese adults experience greater social isolation compared with Asian adults with ancestry from other countries, potentially reflecting differences in community support or language proficiency.

Mental health treatment rates also vary widely across ancestries, with Taiwanese and Bangladeshi adults receiving care at the lowest rates, possibly reflecting cultural stigma around mental health challenges as well as broader structural and historical factors. Among Asian adults with SPD, family or friends are the most common source of mental health support, a practice also seen among all NYC adults.4 This reflects the protective role of informal support networks among Asian communities and emphasizes the need for family- and community-centered mental health care. Together, these findings underscore the importance of disaggregating data to inform culturally tailored mental health initiatives.

Cost remains a major barrier to accessing mental health care among Asian adults with SPD, alongside low mental health literacy and stigma around mental health treatment, consistent with citywide patterns.3 These barriers may be compounded or shaped by structural inequities, including gaps in insurance coverage due to immigration status, a shortage of mental health care providers that speak their native language, and stigma reinforced by the model minority myth.

Addressing these mental health inequities will require the expansion of affordable insurance options, investment in a culturally and linguistically competent mental health workforce, and development of community-led anti-stigma initiatives. Additionally, granular data collection is needed to gain a more nuanced understanding of differences within Asian communities and how intersecting social identities, such as income, immigration status, gender, and English proficiency, affect mental health among this population.

The NYC Health Department promotes inclusion by offering services to all New Yorkers, regardless of immigration status. This includes 988, a free, confidential mental health and substance use support line where trained counselors are available 24/7 by phone in over 200 languages, and NYC Care, which provides low- to no-cost services, including mental health services, to those without health insurance.

References:
  1. 1. State of Change: Asian populations transform New York. Asian American Federation. www.aafederation.org/research/state-of-change-asian-populations-transform-new-york/. Updated January 21, 2022. Accessed December 30, 2025.
  2. 2. King L, Deng WQ, Hinterland K, et al. Health of Asians and Pacific Islanders in New York City. 2021; 1-52. www.nyc.gov/assets/doh/downloads/pdf/episrv/asian-pacific-islander-health-2021.pdf
  3. 3. Vu TT, Zi L, Ngo VK, et al. Serious psychological distress, unmet mental health treatment needs, and help-seeking among Asian American adults in New York City: a population-based study. Soc Sci Med. 2026;392:118931.
  4. 4. The state of mental health of New Yorkers. NYC Department of Health and Mental Hygiene. www.nyc.gov/assets/doh/downloads/pdf/mh/state-of-mental-health-new-yorkers.pdf, updated May 21, 2024. Accessed January 1, 2026.
  5. 5. Vu TT, Borrell LN. Serious psychological distress among Asian Americans/Pacific Islanders in New York City. Presented at: American Public Health Association’s Annual Meeting and Expo, November 2-5, 2025, Washington, D.C.
Suggested citation: Vu TT, Caton J, Close M, King L, and Norman C. Mental Health Inequities among Asian New Yorkers. New York City Department of Health and Mental Hygiene: Epi Data Brief (159); June 2026.

Epi Data Tables

June 2026, No. 159

Mental Health Inequities among Asian New Yorkers

Data Tables
Table 1.Prevalence of serious psychological distress among New York City Asian adults, 2023
Table 2.Prevalence of serious psychological distress by Asian regions and select demographic characteristics among New York City Asian adults, 2023
Table 3.Prevalence of social isolation among New York City Asian adults, 2023
Table 4.Prevalence of serious psychological distress among New York City Asian adults with social isolation, 2023
Table 5.Prevalence of seeking mental health support among New York City Asian adults with serious psychological distress, 2023
Table 6.Prevalence of mental health support sources by Asian regions among New York City Asian adults with serious psychological distress, 2023
Table 7.Prevalence of receiving mental health treatment among New York City Asian adults with serious psychological distress, 2023
Table 8.Prevalence of unmet mental health treatment need among New York City Asian adults with serious psychological distress, 2023
Table 9.Prevalence of barriers to mental health treatment among New York City Asian adults with serious psychological distress that reported an unmet treatment need, 2023
Data Sources

The NYC Neighborhood Wellness Survey (NWS), 2023, conducted May to September 2023, was a collaboration between the Health Department and the City University of New York (CUNY) Graduate School of Public Health and Health Policy. The NWS used a probability-based approach using address-based sampling methods to randomly sample among non-institutionalized adults ages 18 and older. Most surveys were completed by mail with some online completion. Estimates are age-adjusted to the U.S. 2000 standard population and weighted to the adult residential population per the American Community Survey, 2021.

Table 1. Prevalence of serious psychological distress among New York City Asian adults, 2023

Source: Neighborhood Wellness Survey, 2023

Data are weighted to the adult residential population per the American Community Survey, 2021.

Lower 95% Upper 95%
Confidence Confidence
Prevalence Interval Interval p-value
Race and ethnicity (Overall) 8.2 7.9 8.6
American Indian or Alaska Native 12.8 * 5.3 27.6 0.325
Asian 7.4 6.6 8.3 ref
Black 8.3 7.3 9.4 0.174
Latino 10.4 9.6 11.2 <0.001
Middle Eastern or North African 12.0 8.7 16.3 0.020
Native Hawaiian or Other Pacific Islander ^ ^ ^ ^
White 6.6 6.0 7.3 0.155
Multiracial 13.3 10.4 17.0 0.001
Another race 8.2 5.7 11.8 0.606
Region1
East Asia 6.5U 5.6 7.6 0.029
South Asia 9.0 7.2 11.2 ref
Southeast Asia 5.3 3.7 7.6 0.009
Ancestry1
Chinese 5.9 4.9 7.1 ref
Bangladeshi 10.0 7.3 13.7 0.016
Indian 8.1 5.5 12.0 0.193
Japanese ^ ^ ^ ^
South Korean 9.7 6.6 14.2 0.056
Pakistani 9.0 * 4.8 16.1 0.282
Filipino 5.5D 3.0 9.7 0.809
Taiwanese 10.8 6.4 17.6 0.091
Hongkonger 5.8 * 2.1 15.0 0.984
Vietnamese 5.9 * 2.5 13.3 0.989

1Asian heritage or ancestry is self-reported and based on the following question: "What is your ancestry or ethnic origin?" Although captured in two variables, priority was given to the first-reported ancestry for this analysis, resulting in relatively few individuals classified as having mixed Asian ancestry. For the purposes of this publication, East Asia includes China, Hong Kong, Japan, South Korea, Mongolia, Taiwan, and Tibet. South Asia includes Afghanistan, Bangladesh, India, Iran, Nepal, Pakistan, and Sri Lanka. Southeast Asia comprises of Cambodia, Indonesia, Laos, Malaysia, Myanmar, Philippines, Singapore, Thailand, and Vietnam. Only Asian ancestry groups with adequate sample sizes (n≥50) are shown.

*Estimate should be interpreted with caution. Estimate's Relative Standard Error (a measure of estimate precision) is greater than 30%, the 95% Confidence Interval half-width is greater than 10, or the sample size is less than 50, making the estimate potentially unreliable.

^ Data are suppressed due to imprecise and unreliable estimates.

95% Confidence Intervals (CIs) are a measure of estimate precision: the wider the CI, the more imprecise the estimate.

Bold p-values are significant at the 0.05 level.

U When reporting to nearest whole percent, round up, D when reporting to the nearest whole percent, round down.

Table 2. Prevalence of serious psychological distress by Asian regions1 and select demographic characteristics among New York City Asian adults , 2023
Source: Neighborhood Wellness Survey, 2023
Data are weighted to the adult residential population per the American Community Survey, 2021.
Prevalence Lower 95% Upper 95% p-value
Confidence Confidence
Interval Interval
Sex assigned at birth
Male East Asia 5.9 4.7 7.3 ref
South Asia 7.0 5.0 9.7 0.421
Southeast Asia 4.0 * 2.0 7.7 0.215
Female East Asia 7.2 5.8 8.8 0.016
South Asia 11.9 8.8 15.8 ref
Southeast Asia 6.5 D 4.1 9.9 0.019
Sexual orientation
Gay, lesbian, bisexual, or some ot East Asia 12.7 8.8 17.9 ref
South Asia 12.3 6.8 21.3 0.929
Southeast Asia 9.5 * U 3.7 22.3 0.530
Heterosexual East Asia 5.5 U 4.6 6.6 0.016
South Asia 8.4 6.5 10.9 ref
Southeast Asia 4.9 3.2 7.5 0.022
Not sure East Asia 9.6 6.0 15.1 ref
South Asia 12.1 * 5.9 23.3 0.604
Southeast Asia ^ ^ ^ ^ ^
Place of birth2
U.S. born East Asia 7.0 5.5 8.8 ref
South Asia 12.5 U 7.4 20.3 0.096
Southeast Asia 6.1 * 2.7 13.2 0.747
Foreign born East Asia 5.8 4.6 7.4 0.036
South Asia 8.8 6.7 11.5 ref
Southeast Asia 4.5 D 2.8 7.1 0.008
English proficiency
Not at all well/not well East Asia 3.6 2.5 5.2 ref
South Asia 8.8 * 4.4 16.8 0.095
Southeast Asia ^ ^ ^ ^ ^
Well/very well East Asia 6.2 5.2 7.3 0.043
South Asia 8.5 U 6.7 10.8 ref
Southeast Asia 5.2 3.5 7.5 0.019
Education level
High school or less East Asia 4.4 3.2 6.1 0.026
South Asia 7.5 D 5.0 11.1 0.001
Southeast Asia 1.5 * D 0.4 6.0 ref
Some college East Asia 8.2 5.6 12.1 ref
South Asia 9.7 5.4 16.9 0.651
Southeast Asia 7.1 * 3.0 15.7 0.732
Bachelor or higher East Asia 6.7 5.5 8 ref
South Asia 7.8 5.8 10.2 0.386
Southeast Asia 5.4 3.5 8.2 0.342
Health insurance
Yes East Asia 6.4 5.5 7.5 0.027
South Asia 9.0 7.2 11.3 ref
Southeast Asia 5.3 3.6 7.6 0.010
No East Asia 9.2 * 4.7 17.0 -
South Asia ^ ^ ^ ^ ^
Southeast Asia ^ ^ ^ ^ ^

1Asian heritage or ancestry is self-reported and based on the following question: "What is your ancestry or ethnic origin?" Although captured in two variables, priority was given to the first-reported ancestry for this analysis, resulting in relatively few individuals classified as having mixed Asian ancestry. For the purposes of this publication, East Asia includes China, Hong Kong, Japan, South Korea, Mongolia, Taiwan, and Tibet. South Asia includes Afghanistan, Bangladesh, India, Iran, Nepal, Pakistan, and Sri Lanka. Southeast Asia comprises of Cambodia, Indonesia, Laos, Malaysia, Myanmar, Philippines, Singapore, Thailand, and Vietnam. Only Asian ancestry groups with adequate sample sizes are shown.

2Adults born in the U.S. includes individuals born in the U.S. territories (Puerto Rico, Guam, U.S. Virgin Islands, or other U.S. territory).

*Estimate should be interpreted with caution. Estimate's Relative Standard Error (a measure of estimate precision) is greater than 30%, the 95% Confidence Interval half-width is greater than 10, or the sample size is less than 50, making the estimate potentially unreliable.

^ Data are suppressed due to imprecise and unreliable estimates.

95% Confidence Intervals (CIs) are a measure of estimate precision: the wider the CI, the more imprecise the estimate.

Bold p-values are significant at the 0.05 level.

U When reporting to nearest whole percent, round up, D when reporting to the nearest whole percent, round down.

Table 3. Prevalence of social isolation among New York City Asian adults, 2023

Source: Neighborhood Wellness Survey, 2023

Data are weighted to the adult residential population per the American Community Survey, 2021.

Prevalence Lower 95%
Confidence
Interval
Upper 95%
Confidence
Interval
p-value
Race and ethnicity (Overall) 39.6 39.0 40.3
American Indian or Alaska Native 39.8 * 29.3 51.3 0.616
Asian 36.9 35.5 38.4 ref
Black 41.9 40.2 43.6 <0.001
Latino 42.7 41.5 43.9 <0.001
Middle Eastern or North African 42.9 37.7 48.3 0.034
Native Hawaiian or Other Pacific Islander 36.1 * 26.2 47.2 0.876
White 36.9 35.8 38.0 0.990
Multiracial 46.5 U 42.1 50.9 <0.001
Another race 41.5 U 35.6 47.7 0.148
Region1
East Asia 37.1 35.2 39.1 ref
South Asia 35.9 32.7 39.1 0.506
Southeast Asia 35.9 31.1 40.9 0.645
Ancestry1
Chinese 36.6 34.3 39.0 0.007
Bangladeshi 35.5 U 30.5 40.9 0.011
Indian 34.0 29.5 38.7 0.003
Japanese 37.2 * 26.9 48.9 0.155
South Korean 40.9 35.9 46.0 0.179
Pakistani 40.4 * 30.8 50.9 0.311
Filipino 34.4 28.0 41.3 0.012
Taiwanese 46.8 39.9 53.9 ref
Hongkonger 32.4 * 21.6 45.5 0.044
Vietnamese 34.6 26.1 44.2 0.037

1Asian heritage or ancestry is self-reported and based on the following question: "What is your ancestry or ethnic origin?" Although captured in two variables, priority was given to the first-reported ancestry for this analysis, resulting in relatively few individuals classified as having mixed Asian ancestry. For the purposes of this publication, East Asia includes China, Hong Kong, Japan, South Korea, Mongolia, Taiwan, and Tibet. South Asia includes Afghanistan, Bangladesh, India, Iran, Nepal, Pakistan, and Sri Lanka. Southeast Asia comprises of Cambodia, Indonesia, Laos, Malaysia, Myanmar, Philippines, Singapore, Thailand, and Vietnam. Only Asian ancestry groups with adequate sample sizes (n≥50) are shown.

*Estimate should be interpreted with caution. Estimate's Relative Standard Error (a measure of estimate precision) is greater than 30%, the 95% Confidence Interval half-width is greater than 10, or the sample size is less than 50, making the estimate potentially unreliable.

95% Confidence Intervals (CIs) are a measure of estimate precision: the wider the CI, the more imprecise the estimate.

Bold p-values are significant at the 0.05 level.

U When reporting to nearest whole percent, round up, D when reporting to the nearest whole percent, round down.

Table 4. Prevalence of serious psychological distress among New York City Asian adults with social isolation, 2023

Source: Neighborhood Wellness Survey, 2023

Data are weighted to the adult residential population per the American Community Survey, 2021.

Prevalence Lower 95%
Confidence
Interval
Upper 95%
Confidence
Interval
p-value
Overall 17.0 15.2 19.0
Region1
East Asia 15.8 13.5 18.3 ref
South Asia 21.4 16.8 26.8 0.047
Southeast Asia 14.7 10.3 20.7 0.727
Ancestry1
Chinese 14.7 12.1 17.7 ref
Bangladeshi 21.9 15.5 30.0 0.071
Indian 20.4 14.1 28.6 0.151
Japanese 18.8 * 10.5 31.4 0.458
South Korean 19.5 D 13.3 27.6 0.222
Pakistani 22.7 * 11.1 40.8 0.304
Filipino 17.1 9.8 28.2 0.616
Taiwanese 21.1 13.0 32.3 0.213
Hongkonger 15.2 * 6.7 30.9 0.931
Vietnamese 15.2 * 6.5 31.6 0.942

1Asian heritage or ancestry is self-reported and based on the following question: "What is your ancestry or ethnic origin?" Although captured in two variables, priority was given to the first-reported ancestry for this analysis, resulting in relatively few individuals classified as having mixed Asian ancestry. For the purposes of this publication, East Asia includes China, Hong Kong, Japan, South Korea, Mongolia, Taiwan, and Tibet. South Asia includes Afghanistan, Bangladesh, India, Iran, Nepal, Pakistan, and Sri Lanka. Southeast Asia comprises of Cambodia, Indonesia, Laos, Malaysia, Myanmar, Philippines, Singapore, Thailand, and Vietnam. Only Asian ancestry groups with adequate sample sizes (n≥50) are shown.

*Estimate should be interpreted with caution. Estimate's Relative Standard Error (a measure of estimate precision) is greater than 30%, the 95% Confidence Interval half-width is greater than 10, or the sample size is less than 50, making the estimate potentially unreliable.

95% Confidence Intervals (CIs) are a measure of estimate precision: the wider the CI, the more imprecise the estimate.

Bold p-values are significant at the 0.05 level.

U When reporting to nearest whole percent, round up, D when reporting to the nearest whole percent, round down.

Table 5. Prevalence of seeking mental health support among New York City Asian adults with serious psychological distress, 2023
Source: Neighborhood Wellness Survey, 2023
Data are weighted to the adult residential population per the American Community Survey, 2021.

Use horizontal scrolling on narrow screens to view all table columns.

Prevalence Lower 95%
Confidence
Interval
Upper 95%
Confidence
Interval
p-value
Race and ethnicity (Overall) 72.4 70.3 74.4
American Indian or Alaska Native 71.7 * 45.5 88.5 0.531
Asian 64.2 58.4 69.7 ref
Black 70.4 64.9 75.3 0.119
Latino 72.9 69.1 76.3 0.012
Middle Eastern or North African 83.4 * 69.7 91.7 0.002
Native Hawaiian or Other Pacific Islander ^ ^ ^ ^
White 76.9 73.0 80.5 <0.001
Multiracial 78.5 *     D 66.7 86.9 0.016
Another race 44.2 * 28.9 60.6 0.023
Region1
East Asia 66.9 59.1 73.9 ref
South Asia 69.2 * 57.7 78.8 0.729
Southeast Asia 74.0 * 58.2 85.4 0.375
Ancestry1
Chinese 68.0 58.9 76.0 0.006
Bangladeshi 59.8 * 45.3 72.8 0.002
Indian 70.9 * 52.3 84.4 0.071
Japanese 83.9 * 55.8 95.5 0.590
South Korean 60.7 * 44.5 74.9 0.005
Pakistani 59.1 * 30.9 82.4 0.051
Filipino 90.3 * 67.6 97.6 ref
Taiwanese 76.0 * 57.0 88.3 0.175
Hongkonger ^ ^ ^ ^
Vietnamese ^ ^ ^ ^

1Asian heritage or ancestry is self-reported and based on the following question: "What is your ancestry or ethnic origin?" Although captured in two variables, priority was given to the first-reported ancestry for this analysis, resulting in relatively few individuals classified as having mixed Asian ancestry. For the purposes of this publication, East Asia includes China, Hong Kong, Japan, South Korea, Mongolia, Taiwan, and Tibet. South Asia includes Afghanistan, Bangladesh, India, Iran, Nepal, Pakistan, and Sri Lanka. Southeast Asia comprises of Cambodia, Indonesia, Laos, Malaysia, Myanmar, Philippines, Singapore, Thailand, and Vietnam. Only Asian ancestry groups with adequate sample sizes (n≥50) are shown.

*Estimate should be interpreted with caution. Estimate's Relative Standard Error (a measure of estimate precision) is greater than 30%, the 95% Confidence Interval half-width is greater than 10, or the sample size is less than 50, making the estimate potentially unreliable.

95% Confidence Intervals (CIs) are a measure of estimate precision: the wider the CI, the more imprecise the estimate.

Bold p-values are significant at the 0.05 level.

U When reporting to nearest whole percent, round up, D when reporting to the nearest whole percent, round down.

Table 6. Prevalence of mental health support sources by Asian regions1 among New York City Asian adults with serious psychological distress, 2023

Source: Neighborhood Wellness Survey, 2023

Data are weighted to the adult residential population per the American Community Survey, 2021.

Prevalence Lower 95% Confidence Interval Upper 95% Confidence Interval p-value
Lower 95% Upper 95%
Confidence Confidence
Prevalence Interval Interval p-value
Family/friend 42.7 37.3 48.4
East Asia 45.9 38.4 53.6 ref
South Asia 48.3 * 36.6 60.2 0.741
Southeast Asia 62.6 * 46.6 76.3 0.055
Therapist/counselor 21.7 17.6 26.4
East Asia 24.8 18.9 31.9 ref
South Asia 17.8 11.5 26.5 0.166
Southeast Asia 25.0 * 12.8 43.0 0.983
Psychiatrist/prescriber 17.9 13.7 22.9
East Asia 17.8 12.6 24.7 ref
South Asia 22.2 13.9 33.4 0.456
Southeast Asia 9.6 * 4.0 21.3 0.109
Primary care doctor 15.0 11.6 19.3
East Asia 14.0 9.6 20.0 ref
South Asia 17.0 10.6 26.2 0.523
Southeast Asia 10.7 * 4.3 24.2 0.541

1Asian heritage or ancestry is self-reported and based on the following question: "What is your ancestry or ethnic origin?" Although captured in two variables, priority was given to the first-reported ancestry for this analysis, resulting in relatively few individuals classified as having mixed Asian ancestry. For the purposes of this publication, East Asia includes China, Hong Kong, Japan, South Korea, Mongolia, Taiwan, and Tibet. South Asia includes Afghanistan, Bangladesh, India, Iran, Nepal, Pakistan, and Sri Lanka. Southeast Asia comprises of Cambodia, Indonesia, Laos, Malaysia, Myanmar, Philippines, Singapore, Thailand, and Vietnam.

*Estimate should be interpreted with caution. Estimate's Relative Standard Error (a measure of estimate precision) is greater than 30%, the 95% Confidence Interval half-width is greater than 10, or the sample size is less than 50, making the estimate potentially unreliable.

95% Confidence Intervals (CIs) are a measure of estimate precision: the wider the CI, the more imprecise the estimate.

Bold p-values are significant at the 0.05 level.

Table 7. Prevalence of receiving mental health treatment among New York City Asian adults with serious psychological distress, 2023

Source: Neighborhood Wellness Survey, 2023

Data are weighted to the adult residential population per the American Community Survey, 2021.

Lower 95% Upper 95%
Confidence Confidence
Prevalence Interval Interval p-value
Race and ethnicity (Overall) 51.6 49.3 53.9
American Indian or Alaska Native 67.3 * 46.2 83.2 0.006
Asian 39.1 33.7 44.8 ref
Black 47.7 41.9 53.5 0.037
Latino 53.7 49.7 57.6 <0.001
Middle Eastern or North African 56.3 * 40.2 71.1 0.047
Native Hawaiian or Other Pacific Islander ^ ^ ^ ^
White 58.1 53.9 62.2 <0.001
Multiracial 54.5 *      U 42.1 66.4 0.026
Another race 39.4 * 24.8 56.1 0.976
Region1
East Asia 40.8 33.6 48.5 ref
South Asia 34.6 * 24.5 46.2 0.359
Southeast Asia 47.8 * 31.2 64.9 0.470
Ancestry1
Chinese 41.8 32.8 51.4 ref
Bangladeshi 25.4 * 14.7 40.2 0.043
Indian 47.1 * 31.6 63.3 0.581
Japanese 69.7 * 43.1 87.5 0.031
South Korean 44.1 * 30.8 58.3 0.790
Pakistani 38.6 * 14.5 70.0 0.844
Filipino 45.0 * 24.0 67.9 0.807
Taiwanese 26.8 * 18.4 37.4 0.029
Hongkonger ^ ^ ^ ^
Vietnam 41.4 * 15.2 73.6 0.981

Scroll horizontally to view all table columns.

1Asian heritage or ancestry is self-reported and based on the following question: "What is your ancestry or ethnic origin?" Although captured in two variables, priority was given to the first-reported ancestry for this analysis, resulting in relatively few individuals classified as having mixed Asian ancestry. For the purposes of this publication, East Asia includes China, Hong Kong, Japan, South Korea, Mongolia, Taiwan, and Tibet. South Asia includes Afghanistan, Bangladesh, India, Iran, Nepal, Pakistan, and Sri Lanka. Southeast Asia comprises of Cambodia, Indonesia, Laos, Malaysia, Myanmar, Philippines, Singapore, Thailand, and Vietnam. Only Asian ancestry groups with adequate sample sizes (n≥50) are shown.

*Estimate should be interpreted with caution. Estimate's Relative Standard Error (a measure of estimate precision) is greater than 30%, the 95% Confidence Interval half-width is greater than 10, or the sample size is less than 50, making the estimate potentially unreliable.

95% Confidence Intervals (CIs) are a measure of estimate precision: the wider the CI, the more imprecise the estimate.

Bold p-values are significant at the 0.05 level.

U When reporting to nearest whole percent, round up, D when reporting to the nearest whole percent, round down.

Table 8. Prevalence of unmet mental health treatment needs among New York City Asian adults with serious psychological distress, 2023

Source: Neighborhood Wellness Survey, 2023

Data are weighted to the adult residential population per the American Community Survey, 2021.

Prevalence Lower 95%
Confidence
Interval
Upper 95%
Confidence
Interval
p-value
Race and ethnicity (Overall) 46.4 44.1 48.7
American Indian or Alaska Native 62.8 * 37.3 82.7 0.045
Asian 37.2 31.7 43.0 ref
Black 45.6 39.9 51.3 0.042
Latino 44.8 40.9 48.7 0.032
Middle Eastern or North African 54.5 *     D 38.2 69.8 0.050
Native Hawaiian or Other Pacific Islander ^ ^ ^ ^
White 52.4 48.3 56.5 <0.001
Multiracial 58.9 * 45.4 71.3 0.003
Another race 31.7 * 18.4 49.0 0.524
Region1
East Asia 34.0 26.7 42.0 ref
South Asia 33.8 * 24.4 44.7 0.980
Southeast Asia 39.9 * 25.7 56.0 0.503
Ancestry1
Chinese 34.5     U 25.8 44.4 ref
Bangladeshi 40.3 27.6 54.4 0.496
Indian 26.9 * 15.0 43.3 0.383
Japanese 34.2 * 14.0 62.4 0.983
South Korean 31.7 * 19.1 47.6 0.747
Pakistani ^ ^ ^ ^
Filipino 32.5 *     U 17.4 52.6 0.850
Taiwanese 37.8 * 22.9 55.4 0.741
Hongkonger ^ ^ ^ ^
Vietnamese ^ ^ ^ ^

1Asian heritage or ancestry is self-reported and based on the following question: "What is your ancestry or ethnic origin?" Although captured in two variables, priority was given to the first-reported ancestry for this analysis, resulting in relatively few individuals classified as having mixed Asian ancestry. For the purposes of this publication, East Asia includes China, Hong Kong, Japan, South Korea, Mongolia, Taiwan, and Tibet. South Asia includes Afghanistan, Bangladesh, India, Iran, Nepal, Pakistan, and Sri Lanka. Southeast Asia comprises of Cambodia, Indonesia, Laos, Malaysia, Myanmar, Philippines, Singapore, Thailand, and Vietnam. Only Asian ancestry groups with adequate sample sizes (n≥50) are shown.

*Estimate should be interpreted with caution. Estimate's Relative Standard Error (a measure of estimate precision) is greater than 30%, the 95% Confidence Interval half-width is greater than 10, or the sample size is less than 50, making the estimate potentially unreliable.

^ Data are suppressed due to imprecise and unreliable estimates.

95% Confidence Intervals (CIs) are a measure of estimate precision: the wider the CI, the more imprecise the estimate.

U When reporting to nearest whole percent, round up, D when reporting to the nearest whole percent, round down.

Table 9. Prevalence of barriers to mental health care among New York City Asian adults with serious psychological distress that reported an unmet treatment need, 2023

Source: Neighborhood Wellness Survey, 2023

Data are weighted to the adult residential population per the American Community Survey, 2021.

Prevalence Lower 95%
Confidence
Interval
Upper 95%
Confidence
Interval
Barriers to mental health care
Thought could handle mental health without treatment 48.4 39.7 57.2
Could not afford cost of treatment 53.9 * 43.4 64.1
Didn’t know who to contact or where to go 43.3 33.8 53.3
Worried that if I got mental health treatment people would think less of me 31.1 22.5 41.3
Hours or locations were not convenient 27.2 19.5 36.7