Skip to report content

The Food Retail Environment in the South Bronx, 2019 to 2025

Option B: Sticky NavigatorTable of contents14 sections | ShowHide sections

The South Bronx, rich in culture and history, has long faced neighborhood disinvestment, structural racism, and limited economic opportunity. These factors have shaped the health of Bronx residents, where 95% identify as Black and/or Latino.1 Historical practices like redlining, along with the construction of the Cross Bronx Expressway compounded poverty and other inequities.2 In many parts of the South Bronx, half of households are enrolled in the Supplemental Nutrition Assistance Program (SNAP), over a third live below the federal poverty line, more than half are rent burdened, and only 50% of residents ages 16 and older are employed.1 These economic hardships are reflected in population health indicators: the Bronx has the lowest life expectancy of all New York City (NYC) boroughs.3 Limited access to healthy food, exacerbated by economic challenges, contributes to high rates of diabetes and obesity in the Bronx.1, 2, 3

A 2012 study in Crotona-Tremont examined key aspects of the local food environment, including food retail distribution, access to healthier items, and food and beverage advertising.4 This data brief expands on that work in two parts: the first covers four ZIP codes (10451, 10452, 10453, 10454) – with data collected from 2019 to 2024. It adds new data on availability, while continuing to monitor SNAP and Special Supplemental Nutrition Program for Women, Infants, and Children (WIC) acceptance, product placement, and promotion. The second part examines the current state of the food environment in 2025, focusing on affordability and food pricing in 10 of the 11 ZIP codes in the South Bronx.

Data were collected through Shop Healthy Food Environment Audits and Retail Assessments. This brief highlights the South Bronx food environment.

Ratio of supermarkets to fast food restaurants and bodegas in the South Bronx,^ New York City, 2019-2024

For every one
supermarket in the
South Bronx, there are...

1 supermarket

...four fast food
restaurants...

4 fast food restaurants

...and six bodegas.

6 bodegas

^ZIP codes, including 10451, 10452, 10453, 10454

Source: South Bronx Food Environment Audit, 2019/20 - 2023/24
Distribution of food establishments in the South Bronx

  • Between 2019 and 2024, Shop Healthy NYC identified 1,102 food establishments. Bodegas made up the largest share (35%, N=384), followed by fast food restaurants (23%, N=255) and supermarkets (6%, N=64).
  • Limited service and fast-food restaurants represented 23% (N=255) of all establishments identified.
View Data Table & Download CSV
Establishment Type Percentage Count (N)
Bodega35%384
Limited service / fast food23%255
Full service restaurant12%139
Specialty6%64
Supermarket / large grocery store6%64
Variety store4%42
Fruits and vegetables3%29
Others11%127
Download as CSV
  • Fresh produce stores made up just 3% (N=29) of establishments, highlighting major gaps in healthy food access.
  • There was one supermarket for every six bodegas and four fast food restaurants; in the 2012 Crotona–Tremont study, the ratio was one supermarket to ten bodegas.

Availability of healthy foods in supermarkets and bodegas

  • Between 2019 and 2024, while most bodegas sold fresh produce (68%), 32% lacked fresh vegetables (excluding onions and potatoes) and 13% lacked fruit. In contrast, nearly all supermarkets offered fruit (98%) and vegetables (100%).
  • Of bodegas and supermarkets with delis present (168 bodegas, 20 supermarkets), only 3% of bodegas and 5% of supermarkets listed healthy options like sandwiches on whole wheat bread or meals with fruit or water. Prepared healthy foods were limited in both store types.
  • Bodegas typically stocked many packaged snacks, but healthier alternatives were less common: 37% had unsweetened nuts or dried fruit, 20% had baked chips, and 15% had granola bars that met the NYC food standards. Supermarkets had greater healthy snack availability and carried many of the same types of healthier snacks as bodegas, but in higher volume.
  • Less than half (44%) of bodegas carried low-sodium canned goods, whole wheat bread, or low-fat milk. All supermarkets offered them, with 82% carrying low-sodium canned goods.

Definitions: Produce – fresh fruits and vegetables (excludes onions, potatoes, lemons, limes, herbs, and canned, frozen, or dried fruits and vegetables).

Whole wheat bread – At least 2 grams of fiber per slice and whole grain listed as the first ingredient.

Healthier foods comply with the NYC Food Standards and are in a grab-and-go, snack-sized package; excludes items such as boxes containing multiple granola bars and large bags of chips.

Unhealthy foods exceed the Vending Food Standards for healthier snacks, such as those high in added sugars, sodium, saturated fat, or calories.

Low sodium canned goods – 480 mg of sodium or less per serving for soup, 290 mg of sodium or less per serving for beans and vegetables, AND front label indicates that the product is low in sodium.

Sugary drinks have added caloric sweetener and more than 25 calories per 8-ounce serving.

Low-calorie drinks have 25 calories or fewer per 8 oz.

Excluded advertisements: those that were incorporated into the product display (e.g., branded refrigerators, advertisements on awnings, etc.) and advertisements for multiple products (e.g., advertisements for sugary and low-calorie drinks together) were excluded.

Limitations in nutrition support

  • The SNAP and WIC programs support low-income families in accessing food. In 2019-2024, 84% of bodegas accepted SNAP, but only 8% accepted WIC. In contrast, nearly all supermarkets accepted both. The disparity in WIC acceptance, marked by a low percentage of participating bodegas, limits where families can use their benefits, reinforcing inequities in access to food purchasing options across neighborhoods.

Data Sources: Shop Healthy Retail Assessments (Program Years 7-12, 2019/20 - 2024/25): 292 food retailers were identified through canvassing selected ZIP codes and using other data sources- NY State Department of Agriculture and Markets (NYS Ag and Mkt), DOHMH Restaurant Inspection Records, NYC Parks Green Thumb Urban Garden Program, NYC Food Help Map, and NY State Department of Health Vendor Licensing. In-store assessments captured availability, pricing, quality, placement, and promotion to guide store support. Shop Healthy Food Audit Assessments (Program Years 7-11, 2019-2024): 1,102 unique food-related sites were identified through canvassing selected ZIP codes, data from NYS Ag and Mkt, and online sources. Audits included retail, non-retail, agricultural, and emergency food sites to support recruitment and partnerships.

Most frequently advertised products in bodegas and supermarkets

  • In 2019-2024, we assessed advertising in 292 stores in the South Bronx, tallying the number of ads for sugary drinks, low-calorie drinks, water, milk, snacks, canned goods, bread, produce, alcohol, and tobacco.
  • Sugary drink ads were most prevalent, observed in 239 stores, present in 67% of bodegas compared with only 11% of supermarkets. Alcohol ads were found in 47% of bodegas versus 8% of supermarkets.
  • Alcohol and sugary drink ads remained widespread across the Bronx, with only modest drops in 2019-2024, compared with trends observed in the 2012 Crotona-Tremont study.4 Tobacco ads were less prevalent in the 2019-2024 assessment, compared with the 2012 study.
Top five products advertised by bodegas and supermarkets in the South Bronx, New York City, 2019–2024
Percentage of stores advertising products
Bodega/Deli
Supermarket
67%
11%
Sugary drink
ads
47%
8%
Alcohol ads
27%
3%
Snack ads
19%
3%
Water ads
14%
0%
Tobacco ads
N=292 Food Retail Stores
Source: Shop Healthy Assessments, 2019/20 -2023/24

Food and non-alcoholic beverage ads present in the South Bronx

Ad type and distribution breakdown in the South Bronx, New York City, 2019–2024
68% Sugary Drinks
18% Unhealthy Food
7% Water
6% Healthy Snacks
1% Produce
N=3,452 advertisements
Source: Shop Healthy Food Retail Assessments, 2019-2024
  • In 2019-2024, of the 3,452 food and non-alcoholic beverage ads assessed, 68% were for sugary drinks, followed by 18% for unhealthy food items. Ads for water accounted for 7%, healthy non-produce foods 6%, and fresh produce just 1% of the total distribution.
  • For every healthy food or beverage ad (water, low-calorie drinks, healthy snacks, whole grains, or produce), there were roughly five unhealthy food or beverage ads (sugary drinks, unhealthy snacks, whole milk, white bread, and standard canned goods that are not “low sodium” or “no added sugar”).
  • Our data highlight that predatory marketing of unhealthy items and displays are very common in low-income communities like the South Bronx; other studies support these findings and show that these practices are less common in wealthier areas, exacerbating health inequities.5

Availability and affordability in the South Bronx

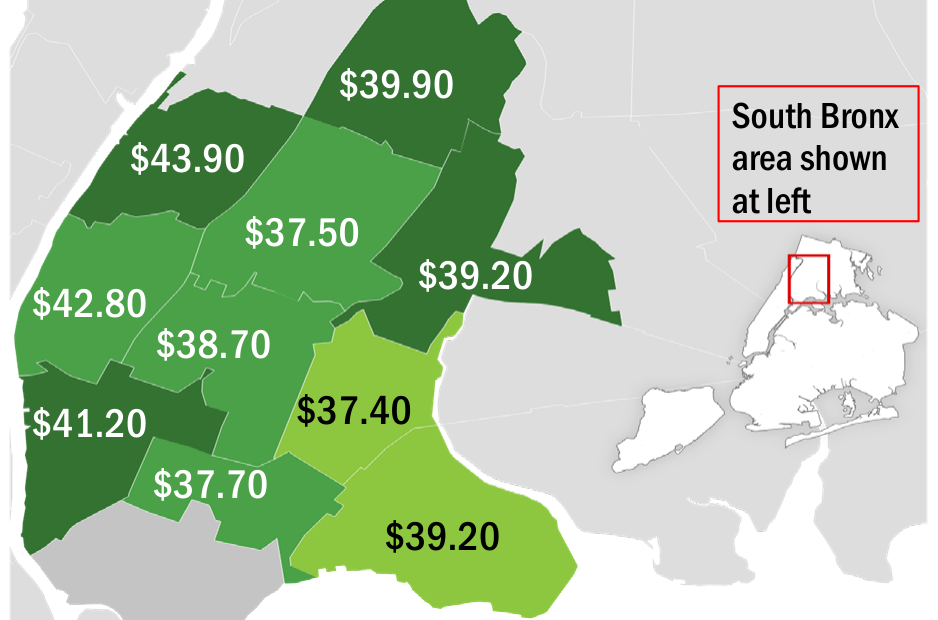
  • In 2025, the cost of a standard food basket across 10 South Bronx ZIP codes ranged from $37.40 to $43.00.
  • In 6 out of the 10 South Bronx ZIP codes, less than 80% of food basket items were available, reflecting gaps in access.
A standard food basket used by the Shop Healthy program to assess costs includes staples such as eggs, avocados, deli beef, tomatoes, lettuce, bread, oranges, potatoes, water, milk, and bananas. These items commonly align with other food basket studies. Data on costs were collected in stores during the Retail Assessment. Food standard baskets for each ZIP code were calculated by averaging the cost of a standard food basket in all stores assessed in the ZIP code.
Average food basket cost and availability in the South Bronx ZIP Codes,^ New York City, 2025
Map of South Bronx ZIP codes showing average food basket cost per ZIP code, ranging from $37.40 to $43.90
Availability of food basket items
Unknown
50%-65%
66%-80%
Over 80%
N=113 South Bronx Sustainability Food Retail Stores; ^ZIP codes 10451, 10452, 10453, 10454, 10455, 10456, 10457, 10458, 10459, 10460, and 10474
Source: Shop Healthy Food Retail Assessments, 2024-2025

Price variability and food affordability

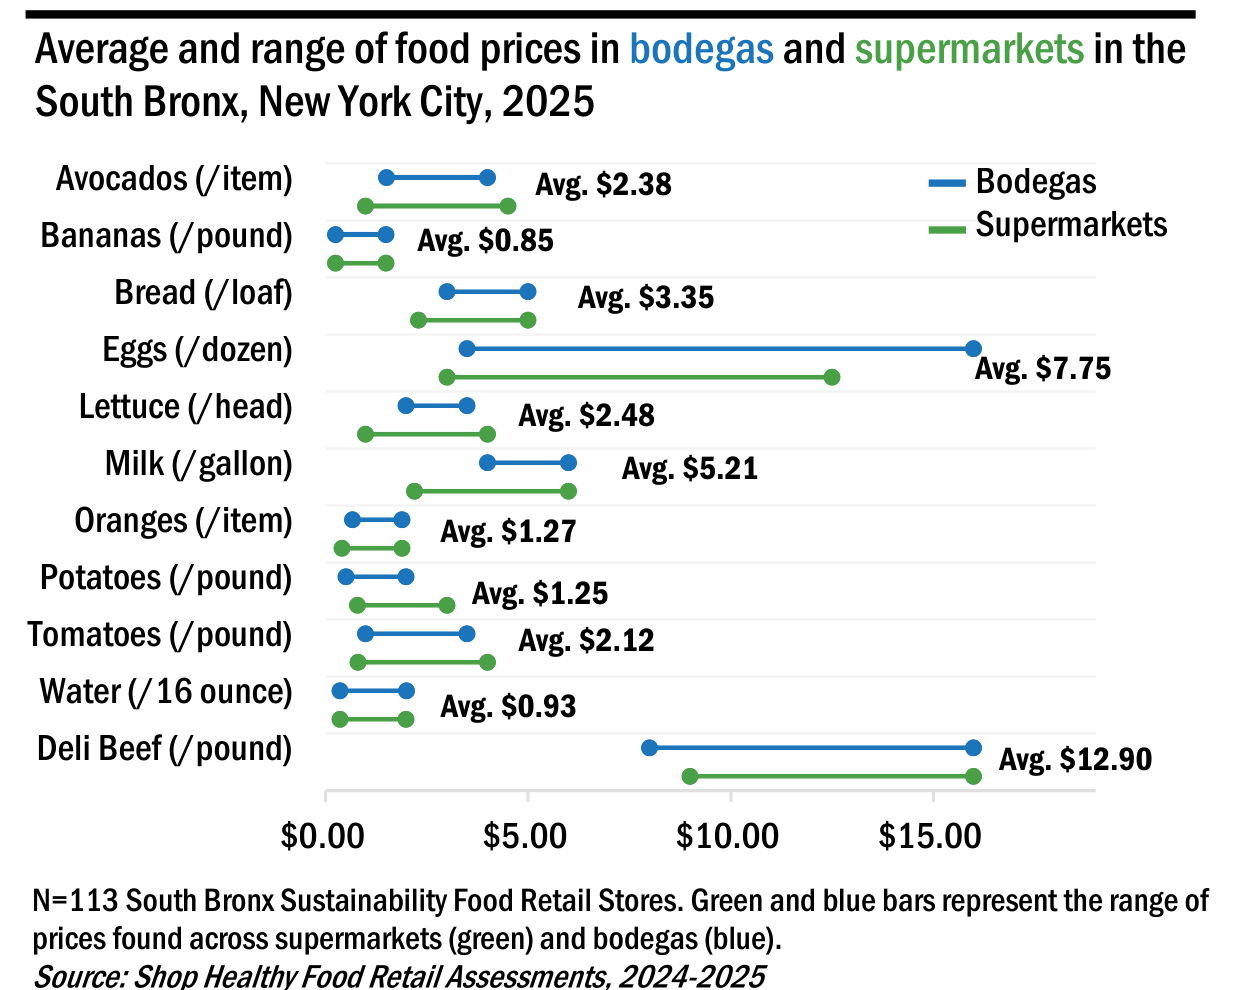
  • Although bodegas outnumber supermarkets in the South Bronx, the cost of food in supermarkets and bodegas was similar.
  • Prices varied substantially across both types of stores regardless of location, with some items more than four times the lowest price. This reflects a challenge in food affordability.
  • In 2025, protein staples like eggs (average $7.75/dozen) and deli beef (average $12.90/pound) were likely affected by national supply disruptions.
  • Produce prices varied sharply: lettuce ($1 to $4.99/head), avocados ($1 to $5/each), tomatoes ($0.79 to $4.99/pound).
Average and range of food prices in bodegas and supermarkets in the South Bronx, New York City, 2025
Food Item Unit Average Price
Avocados/item$2.38
Bananas/pound$0.85
Bread/loaf$3.35
Eggs/dozen$7.75
Lettuce/head$2.48
Milk/gallon$5.21
Oranges/item$1.27
Potatoes/pound$1.25
Tomatoes/pound$2.12
Water/16 ounce$0.93
Deli Beef/pound$12.90
Download as CSV

Implications

Persistent barriers to food access in the South Bronx, such as high prices, limited WIC acceptance, and inconsistent availability of healthier items, can be addressed by expanding and scaling existing programs. These services provided by the Bronx Health Services, Shop Healthy NYC, NYC Green Carts Initiatives, Health Bucks, Groceries to Go, Get the Good Stuff, FRESH, More Veggies and similar programs will support local retailers, affordability, and access to healthy food in underserved neighborhoods.

Policies that make healthy food more affordable and accessible in communities with high burden of food insecurity can improve overall health outcomes and access to nutritious options. Strengthening policies to promote and incentivize healthier food retail practices and regulate food marketing are vital to reduce disparities in food environments. Finally, ongoing research and evaluation of food access, led by community input and equity-focused data, is crucial for food security and supporting the health and dignity of all residents.

Health equity is attainment of the highest level of health and well-being for all people. Not all New Yorkers have the same opportunities to live a healthy life. Achieving health equity requires focused and ongoing efforts to address historical and contemporary injustices such as discrimination based on social position (e.g., class, immigration status) or social identities (e.g., race, gender, sexual orientation). For more information, visit the World Health Organization’s Health Equity webpage.

Authored by: Natasha Mills, Ipsita Krishnan, Stephanie Saintilien, and Chantelle Brathwaite

Acknowledgements: Gincarlos Andrade, Lorena Santana, Ludmila Pacheco Ramos, Aldo Crossa, Lauren Shiman

References:

1. U.S. Census Bureau, 2019-2023 American Community Survey 5-Year Estimates. 2024. Accessed August 25, 2025. data.census.gov

2. Reimagine the Cross Bronx: Existing conditions summary report. City of New York. August 2024. Accessed August 25, 2025. Available at: crossbronx.info/sites/default/files/2024-08/existing-conditions-report.pdf

3. Community Health Profiles: Mott Haven and Melrose (201), Hunts Point and Longwood (202), Morrisania and Crotona (203), Highbridge and Concourse (204). New York City Department of Health and Mental Hygiene. Accessed August 25, 2025. nyc.gov/health/profiles
4. Wong BC, Dannefer R. Describing the food environment in the South Bronx neighborhood of Crotona-Tremont. New York City Department of Health and Mental Hygiene: Epi Data Brief (44); April 2014.

5. Fraser KT, Ilieva RT, James CJ, et al. Use of Environmental Scan to Assess Density, Content, and Variation of Predatory Food and Beverage Marketing in New York City. Health Place. 2022;76:102843.

Suggested citation: Mills N, Krishnan I, Saintilien S, and Brathwaite C. The Food Retail Environment in the South Bronx, 2019-2024. New York City Department of Health and Mental Hygiene: Epi Data Brief (158); April 2026.

MORE New York City Health Data and Publications at nyc.gov/health/data
EpiQuery – the Health Department’s interactive health data system at nyc.gov/health/EpiQuery
Community Health Profiles at nyc.gov/health/Profiles

Data appendix

Epi Data Tables

The Food Retail Environment in the South Bronx, 2019 to 2025

Data Tables
Table 1.
Table 1. Characteristics of the retail food environment in the South Bronx, New York City, 2019-2024
Table 2.
Table 2. Economic and demographic characteristics of the South Bronx, New York City, 2019-2023
Table 3.
Table 3. Availability of healthy foods in grocery stores and bodegas in the South Bronx, New York City, NY, 2019-2024
Table 4.
Table 4. Products advertised by bodegas and grocery stores in the South Bronx
Data Sources

Shop Healthy Retail Assessments (Program Years 7-11): 292 food retailers were identified through canvassing selected ZIP codes and using state data. In-store assessments captured availability, pricing, quality, placement, and promotion to guide store support.

Shop Healthy Food Audit Assessments (Program Years 7-11): 1,110 food-related sites were identified through canvassing selected ZIP codes, state data, and online sources. Audits included retail, non-retail, agricultural, and emergency food sites to support recruitment and partnerships.

U.S. Census Bureau, 2019-2023 American Community Survey 5-Year Estimates are used to describe economic and demographic characateristics of the South Bronx. Accessed August 25, 2025, from data.census.gov

Table 1. Characteristics of the retail food environment in the South Bronx, New York City, 2019-2024
Source: The Shop Healthy Food Environment Audit 2019-2024

On smaller screens, each site type is shown with all program-year and total values.

Primary Site Type Program Year 7,
2019-2020
(N=225)
Program Year 8,
2020-2021
(N=219)
Program Year 9,
2021-2022
(N=230)
Program Year 10,
2022-2023
(N=233)
Program Year 11,
2023-2024
(N=195)
Total (N=1102)
Count Percent Count Percent Count Percent Count Percent Count Percent Count Percent
Bodega 68 30% 86 39% 82 36% 80 34% 68 35% 384 35%
Limited Service / Fast Food 56 25% 42 19% 63 27% 60 26% 34 17% 255 23%
Full Service Restaurant 39 17% 32 15% 20 9% 10 4% 38 19% 139 12%
Specialty 8 3% 12 5% 12 5% 24 10% 8 4% 64 6%
Supermarket / Large Grocery 9 4% 15 7% 20 9% 14 6% 4 2% 62 6%
Variety Store 8 3% 5 2% 12 5% 12 5% 5 3% 42 4%
Fruits and Vegetables 4 2% 8 4% 3 1% 13 6% 1 1% 29 3%
Others 33 16% 19 9% 18 8% 20 9% 37 19% 127 11%

Table 2. Economic and demographic characteristics of the South Bronx, New York City, 2019-2023

Source: American Community Survey, 2019-2023 5-year estimates (U.S. Census Bureau)

On smaller screens, each value is shown with its column label for easier reading.

Characteristic South Bronx ZIP Code Total S. Bronx
7.93%
Total NYC
10451 10452 10453 10454 10455 10456 10457 10458 10459 10460 10474
Total Population1 48,975 76,745 78,270 40,368 42,940 86,958 79,375 78,741 49,753 61,101 11,188 654,414 8,258,035
Housing ownership and rent
% Owner occupied homes1 13.6 3.3 4.9 6.4 10.3 6.6 6.2 3.9 11.8 10.7 8.4 7.8 32.5
% Rent burdened2,3 48.8 53 53.3 50.7 51 49.3 51.5 52 54.1 53.2 52.5 51.8 52.1
Median house value (dollars)4 $263,500.00 $263,000.00 $580,100.00 $780,800.00 $348,700.00 $428,800.00 $336,900.00 $515,700.00 $589,500.00 $589,300.00 not available $469,630.00 -
Socioeconomic characteristics
% Enrolled in SNAP5,6 42.8 49.1 50.3 50.7 50.7 52 49.2 44.7 47.4 52.3 40.7 48.2 39.4
% Households with income <100% FPL1 32.1 35.6 33.7 42.8 33 36.8 34.1 29.8 33.5 33.9 31.5 34.3 18.2
% Employed (population 16+)5 50.8 50.4 51.2 44.5 47.1 47 51.6 53.8 50.4 50.1 56.8 50.3 53.8
% That didn't complete high school1 25.9 28.5 31.1 37.8 30.8 32 29.6 32.3 31.6 29.4 26.6 30.5 15.8
% Not an English speaker1,7 24 33.2 33.4 27.1 28.4 27 31.8 35 29.7 28.5 24.9 29.4 23.1
Race/Ethnicity1
% American Indian and Alaska Native 0.6 1.0 1.7 2.6 1.3 1.4 1.1 1.7 1.0 1.1 1.1 1.3 0.9
% Asian 1.1 0.9 1.3 0.6 1.5 0.8 0.7 3.8 1.1 1.0 0.4 1.2 15.0
% Black/ Black American 47.7 34.7 32.8 30.1 30.4 47.5 41.7 18.3 34.4 36.4 30.7 35.0 22.0
% Native Hawaiian/ Other Pacific Islander 0.6 0.0 0.4 1.4 0.2 0.0 0.1 0.0 0.3 0.0 1.4 0.4 0.1
% Some other race 24.9 37.7 36.0 39.6 41.3 26.3 28.2 54.5 39.4 31.2 42.2 36.5 15.9
% White 13.1 11.7 11.3 12.1 8.5 10.2 9.0 11.3 7.9 10.7 6.6 10.2 33.7
% White Alone, not Hispanic or Latino 6.0 2.7 2.0 3.3 1.3 2.8 1.9 7.6 1.2 3.3 1.8 3.1 31.0
% Two or more races 12.0 37.7 16.7 13.6 16.8 13.8 19.1 10.2 15.9 19.5 17.6 17.5 12.5
% Hispanic/ Latino (of any race) 50.8 65.3 67.2 70.2 70.6 52.2 63.2 70.2 66.3 65.4 71.5 64.8 28.4
Health Insurance
% With no health insurance5 9.8 8.2 13.1 9.5 9.8 11 12.8 7.4 6.1 9.5 10.3 9.8 6.7
Neighborhood inequality
Gini Index8 0.5296 0.4971 0.5257 0.6013 0.5197 0.5209 0.5078 0.4913 0.5224 0.5207 0.4867 0.5203 0.5546
Download Table 2 as CSV
Location Median House Value
US $340,200.00
NY State $420,200.00
Bronx County $498,200.00
Richmond County $672,400.00
Queens County $699,200.00
Kings County $880,300.00
New York County $1,010,800.00
Download Location Table as CSV
  1. From S0501 - Selected Characteristics of the Native and Foreign-Born Populations
  2. From DP04 - Selected Housing Characteristics - GRAPI (35% or more)
  3. Rent burdened defined as gross rent 35% or more of household income
  4. From B25077 - Owner occupied housing units
  5. From DP03 - Selected Economic Characteristics
  6. Households receiving SNAP in past 12 months
  7. Percent reporting they speak English less than "very well"
  8. From B19083 - Gini Index of Income Inequality. The Gini index, also known as the Gini coefficient, is a numerical indicator that shows the degree of income or wealth inequality in a given population.

Table 3. Availability of Healthy Foods in Grocery Stores and Bodegas in the South Bronx, New York City, NY, 2019-2024

Source: The Shop Healthy Retail Assessment 2019-2024

Category Bodega/Deli
Count of stores with item present (N=225)
% of stores with items present
Supermarket
Count of stores with item present (N=40)
% of stores with items present
Total Count Total %
Bodega/Deli Supermarket Total
Count
Total %
Category Count of stores
with item present
(N=225)
% of stores
with items
present
Count of stores
with item present
(N=40)
% of stores
with items
present
Produce
Fruits 197 67.5% 39 13.4% 257 88.0%
Vegetables 162 55.5% 40 13.7% 228 78.1%
Packaged ready-to-eat fruits/veg 15 5.1% 19 6.5% 35 12.0%
Produce at checkout 68 23.3% 1 0.3% 70 24.0%
Produce at front entrance 86 29.5% 18 6.2% 110 37.7%
Canned Goods
Low-sodium canned vegetables 65 22.3% 37 12.7% 107 36.6%
Low-sodium canned beans 73 25.0% 39 13.4% 126 43.2%
Low-sodium canned soup 40 13.7% 27 9.2% 72 24.7%
Canned fruit in 100% juice 137 47.0% 38 13.0% 181 62.0%
Whole Grains
Whole grains 60 20.5% 18 6.2% 78 26.7%
Low-Fat Milk
Low-fat milk 91 31.2% 19 6.5% 110 37.7%
Healthy Deli Options (Menu Items)
Low-sodium meats 44 15.1% 12 4.1% 56 19.2%
Lower-sodium cheese 56 19.2% 15 5.1% 71 24.3%
Low-fat cheese 35 12.0% 9 3.1% 44 15.1%
Healthier Grab-and-Go Snacks
Nuts and seeds 108 37.0% 19 6.5% 133 45.5%
Dried fruit 92 31.5% 17 5.8% 114 39.0%
Nuts and dried fruit 90 30.8% 18 6.2% 114 39.0%
Granola/Cereal 44 15.1% 15 5.1% 61 20.9%
Chips 59 20.2% 13 4.5% 74 25.3%

Table 4. Products advertised by bodegas and grocery stores in the South Bronx

Source: Shop Healthy NYC Phase 1 Pre-Assessment (2019-2024)

Number of
Advertisements in
Grocery Stores
Number of
Advertisements
in Bodegas
Number of
Advertisements in
Other Store Types
Total Number of
Advertisements
Category of Ads
Sugary drinks 110 1,633 25 1,768
Alcohol 29 698 20 747
Tobacco 37 1 0 38
Low calorie drinks 19 51 6 76
Regular Groceries and Snacks 41 427 3 471
Healthier Foods 66 109 0 175
Water 149 32 4 185
Total 451 2,951 58 3,460