Accessible view
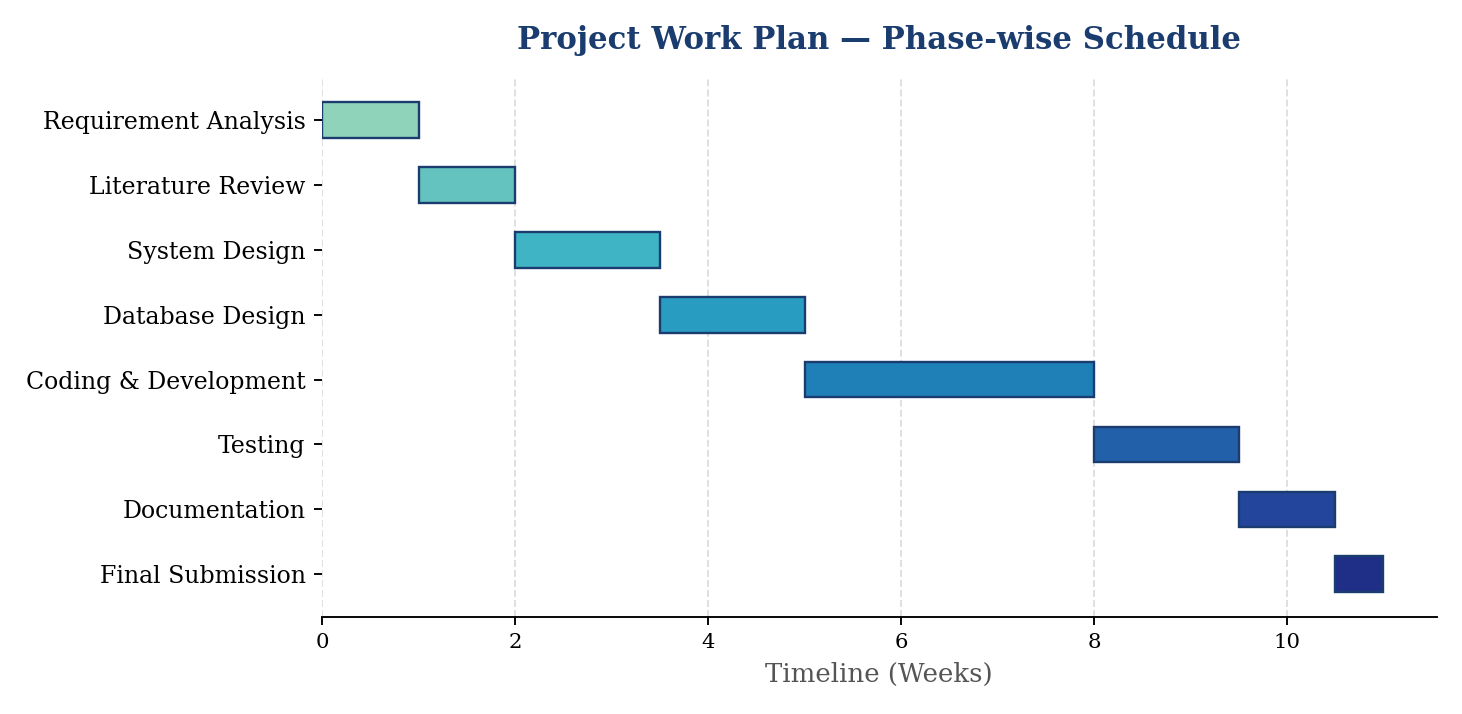
The following table provides the exact numerical schedule and duration of each development phase represented in the Gantt chart:
On narrow screens, scroll horizontally to view all schedule columns.
| Phase Name | Start (Week) | End (Week) | Duration (Weeks) |
|---|---|---|---|
| Requirement Analysis | 0.0 | 1.0 | 1.0 |
| Literature Review | 1.0 | 2.0 | 1.0 |
| System Design | 2.0 | 3.5 | 1.5 |
| Database Design | 3.5 | 5.0 | 1.5 |
| Coding & Development | 5.0 | 8.0 | 3.0 |
| Testing | 8.0 | 9.5 | 1.5 |
| Documentation | 9.5 | 10.5 | 1.0 |
| Final Submission | 10.5 | 11.0 | 0.5 |