Here is what we found:
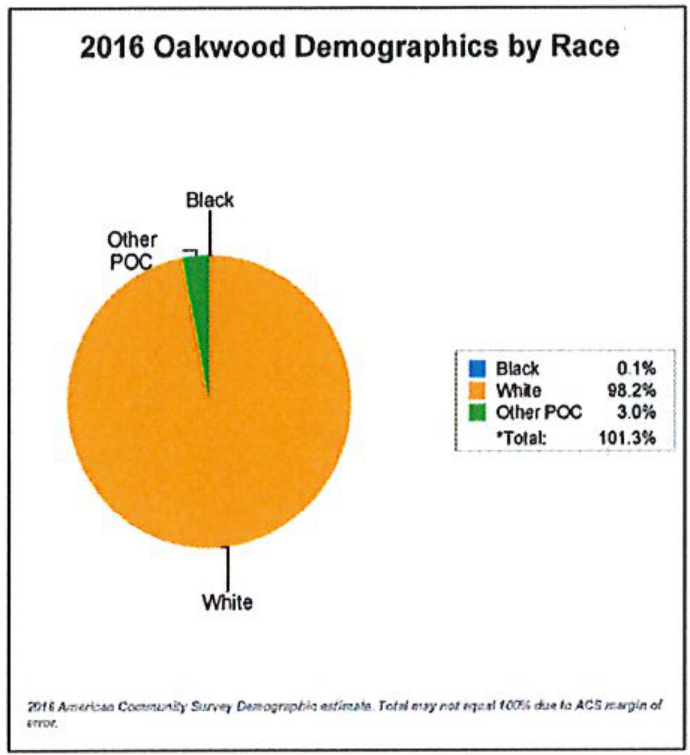
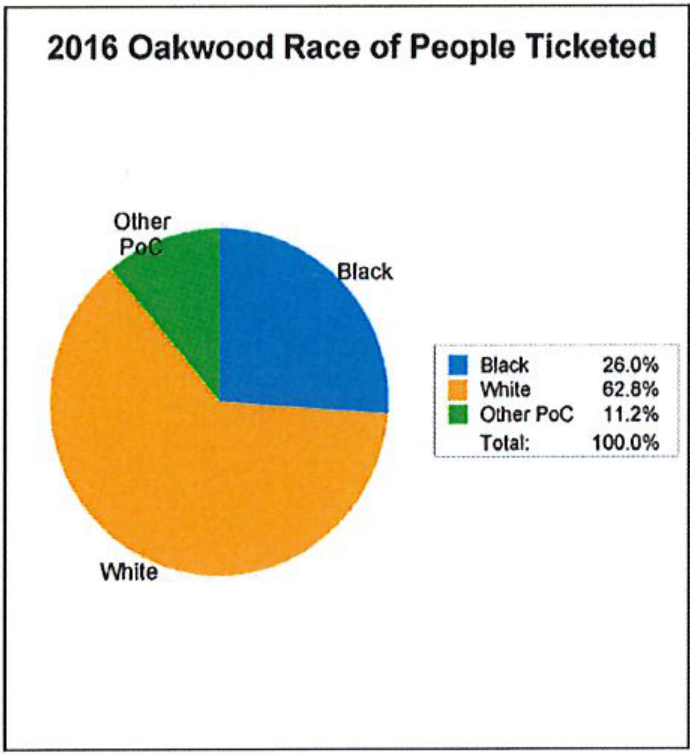
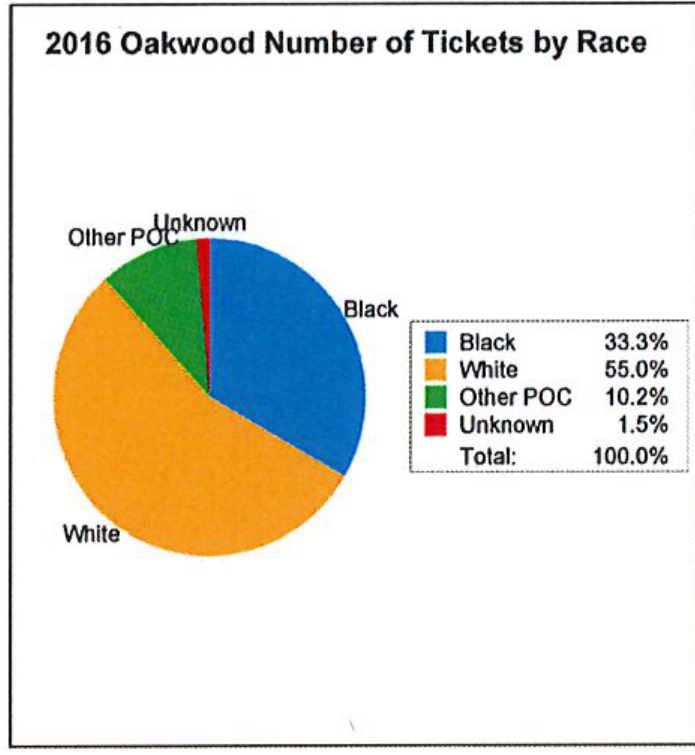
In 2016, Oakwood was 0.1% African American (Figure 1), but 26% of the drivers pulled over and ticketed were African American (Figure 2) and those African American drivers received 33.3% of the tickets written in Oakwood that year (Figure 3).
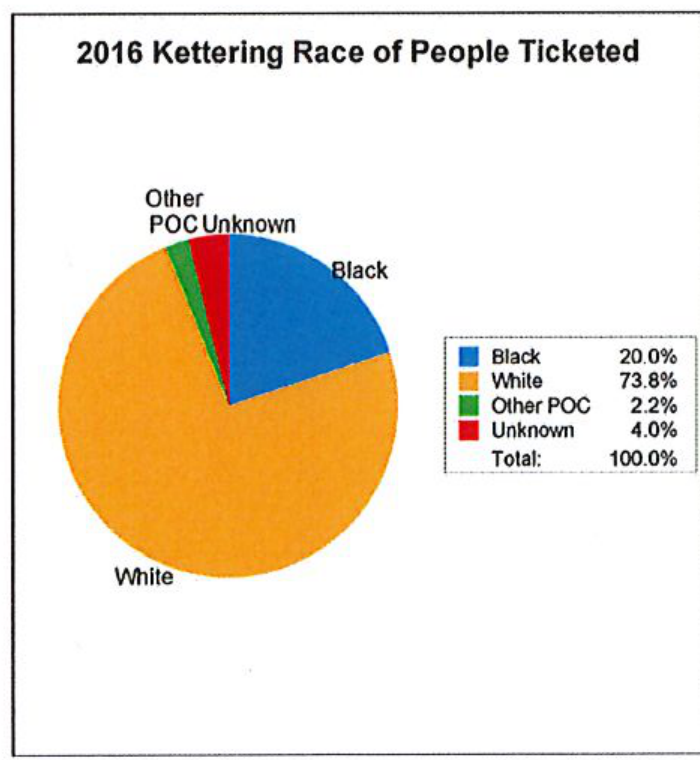
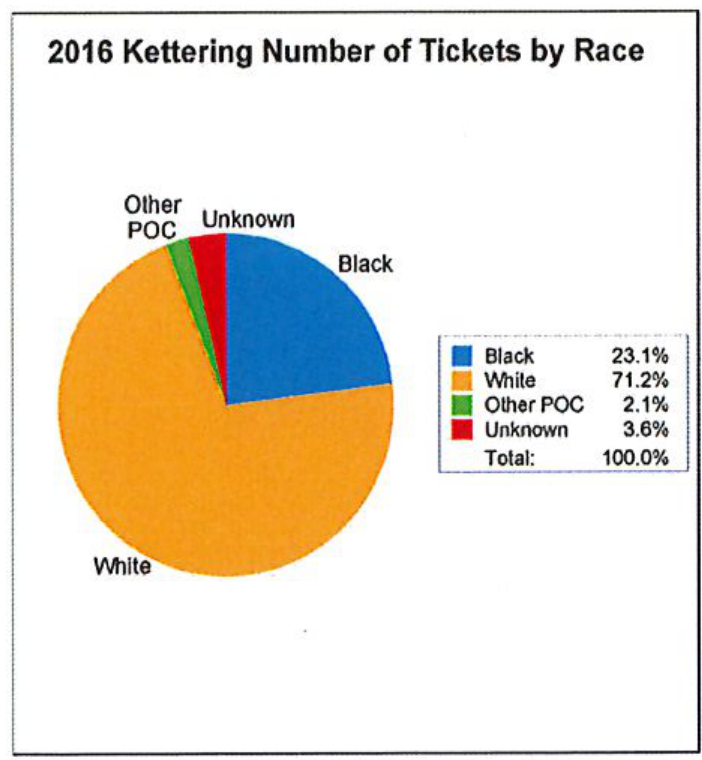
Kettering, which is located next to Oakwood and shares some of the same main traffic arteries, was 4.9% African American in 2016 (Figure 4). In Kettering, 20.1 % of the drivers receiving traffic tickets were African American (Figure 5) and they received 23% of the tickets (Figure 6).
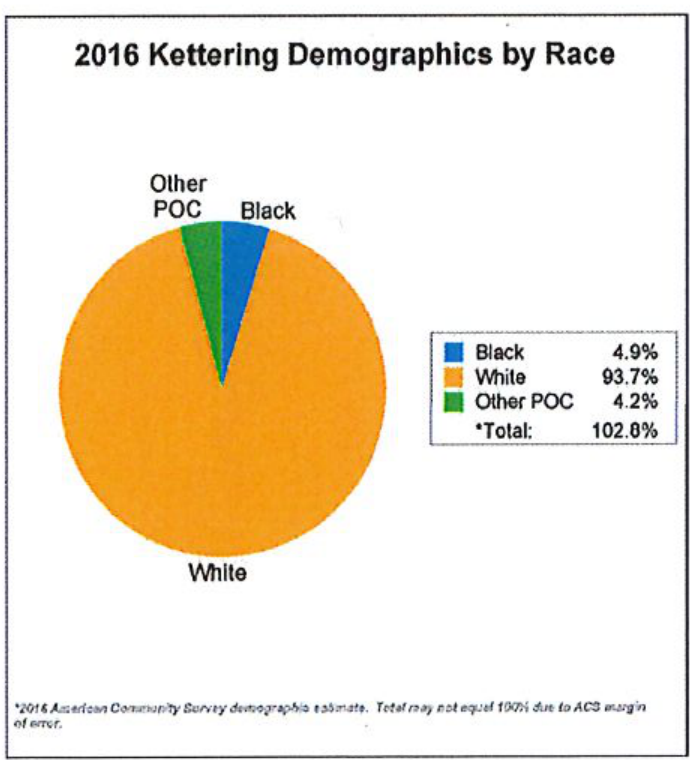
Kettering has a larger African American population than Oakwood and it shares similar through traffic, yet a black person driving through Oakwood was more likely to be stopped and ticketed by the police and receive more tickets when stopped than a black person driving through Kettering.