The Oakwood water plants reduced the hardness level by 66% on the average while the sodium content of the water increased by 261% on the average during 2019. Both of these percentages are within normal operating ranges.
III. WELL PUMPAGE REPORT AND CHARTS
The eight production wells produced 506,086,000 gallons of water in 2020, which is an average of 1,387,000 gallons per day. In 2019, the eight production wells produced 507,833,000 gallons of water. This represents a .35% decrease in raw water produced in 2020. The 2020 maximum day well production was on July 6 at 2,632,000 gallons. It is common that our highest usage occurs during the summer months when many property owners irrigate their lawns. The 2020 minimum day well production was on September 29 at 682,000 gallons. The minimum day production normally occurs in the fall or winter.
Out of the 506,086,000 gallons pumped in 2020, 33,613,000 gallons were used to either backwash the iron and manganese filters or regenerate the softening units at 210 Shafor and 120 Springhouse. This represents 6.64% of the total water pumped for the year, a 2.56% decrease from 2019. The primary flow meters were replaced in 2020 and accurately report plant production.
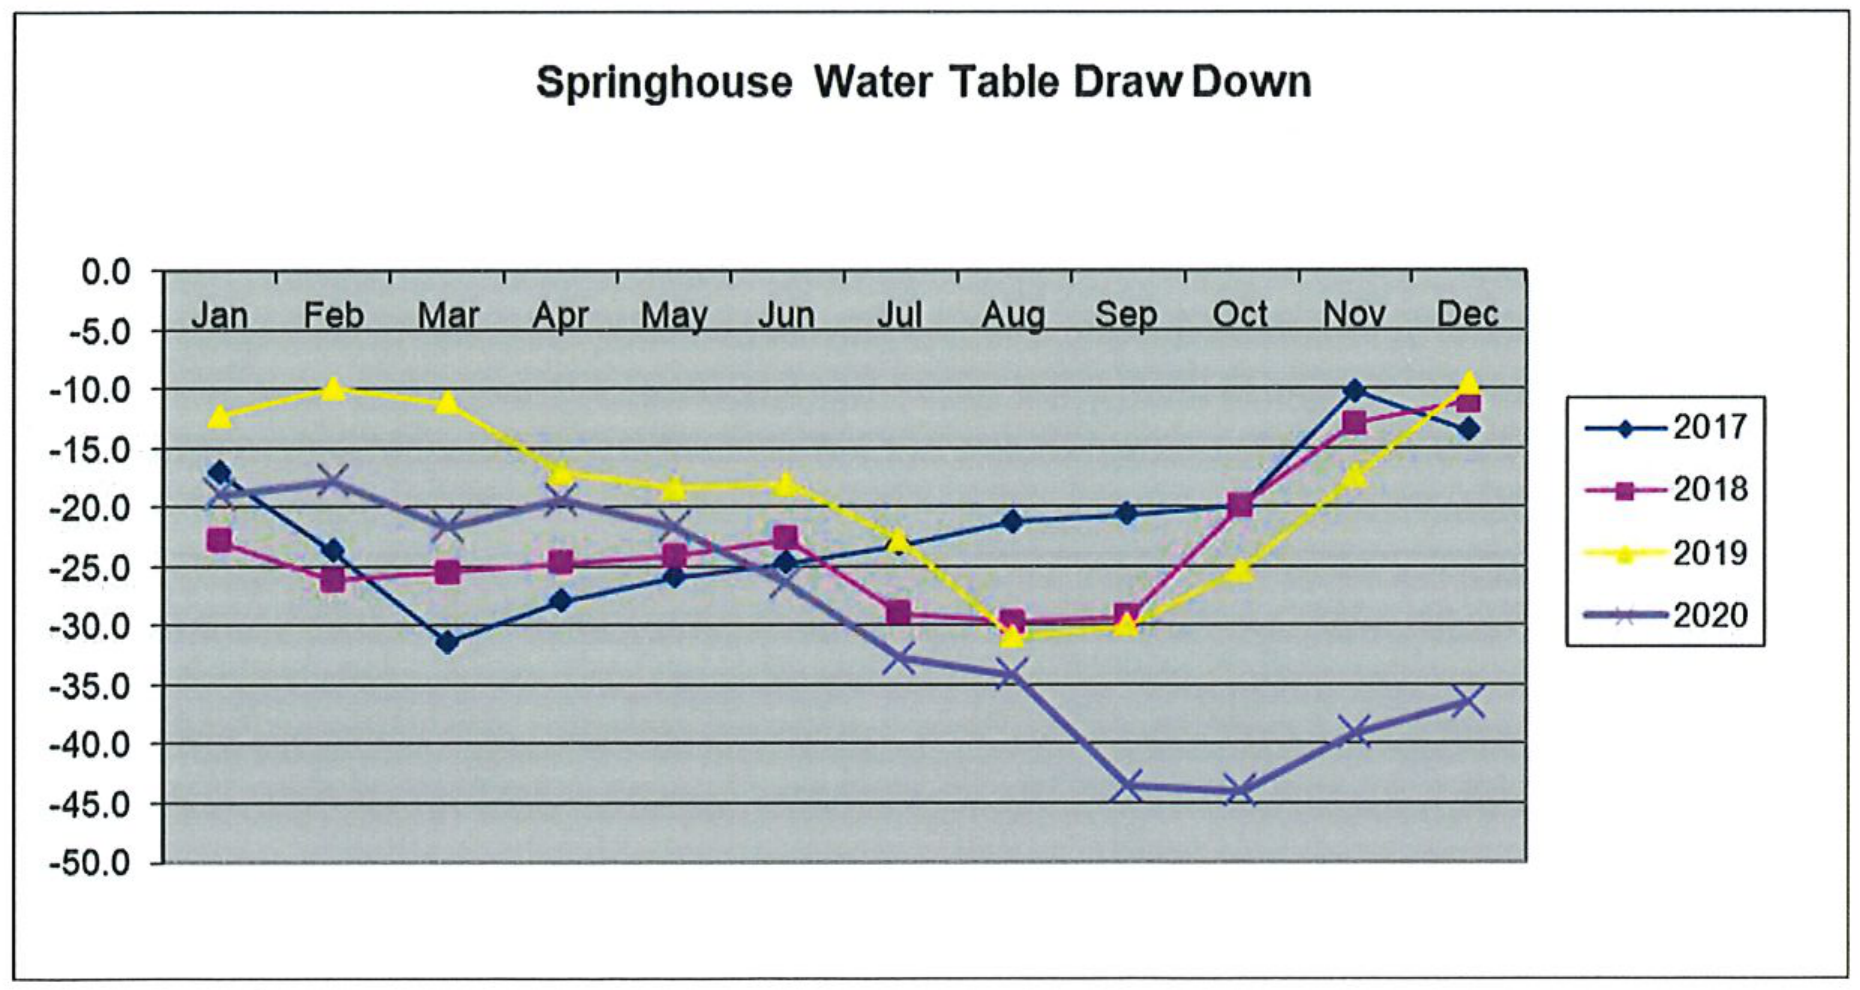
Chart 1 below and Chart 2 on the next page show the 2020 water table draw down compared to 2017, 2018 and 2019.