CHART 2
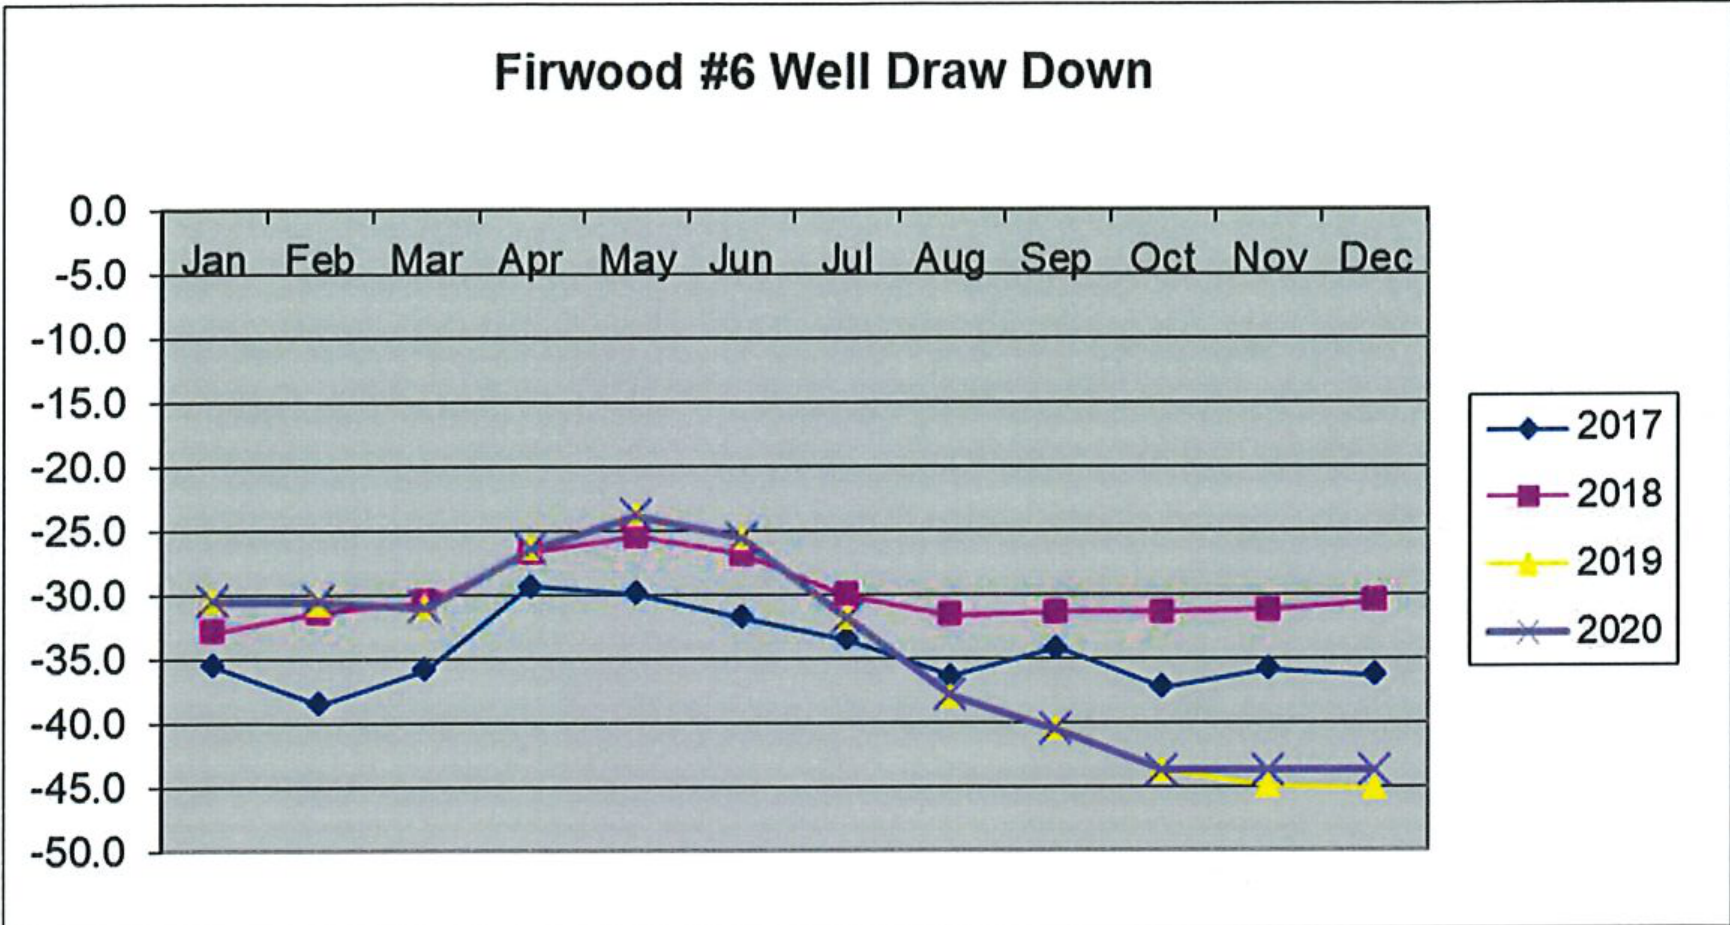
The aquifer water levels in the wells have not been heavily stressed for many years due to relatively mild summers with plenty of rain. At the end of 2020 we experienced a mild drought for several months resulting in the drop in the water table at the end of 2020, most pronounced at Springhouse. The rest of the wells at Firwood (Wells #4, #7 and #8) experienced drawdowns similar to Well #6.
Table 3 on the next page shows a comparison of total well production in gallons per well per month for 2019 and 2020.
IV. TOTAL PUMPAGE TO SYSTEM REPORT AND CHARTS
The City was able to produce water to meet 99.71% of the total demand of 456,549,000 gallons (1,250,819 avg/day). The maximum day system usage was on July 6 at 2,393,000 gallons and the minimum day system usage was on September 6 at 816,000 gallons. No fire events (i.e., extra demand) occurred in 2020 that required city of Dayton or Montgomery County water. During the month of August and September we did purchase 1,345,000 gallons due to a power failure at the Springhouse facility.