
Visualization
The top of the report holds the patient's basic medical information and test details.
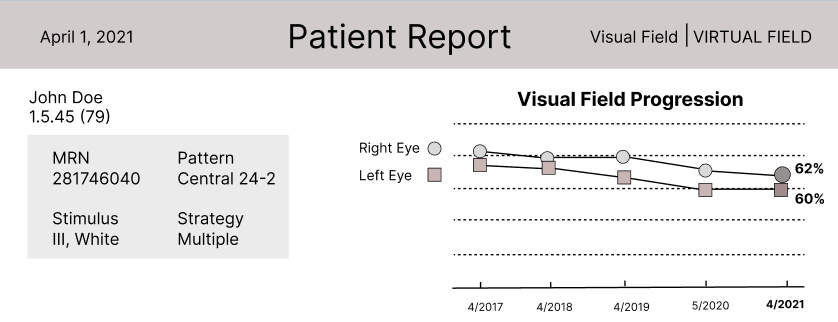
The title Visual Field Index was relabeled Visual Field Progression to use simpler language.
Accessible view
Patient Details: John Doe (Age 79), MRN: 281746040, Pattern: Central 24-2, Stimulus: III White, Strategy: Multiple. Report Date: April 1, 2021.
Visual Field Progression Over Time
The chart plots both eye series at five report dates: 4/2017, 4/2018, 4/2019, 5/2020, and 4/2021. The first four plotted points do not have printed numeric values.
- Right Eye (circles): the plotted line trends downward overall and ends at 62% on 4/2021.
- Left Eye (squares): the plotted line trends downward overall and ends at 60% on 4/2021.