APPENDIX C – ADDITIONAL HCA AND DENDROGRAMS/MDS
Open full-size chart in a new tab
Chart description
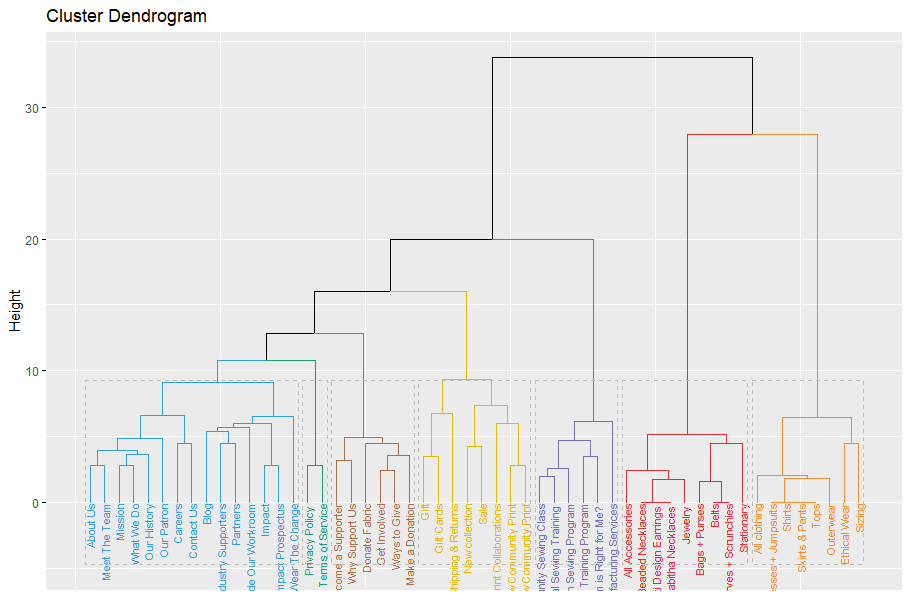
The chart is titled “Cluster Dendrogram.” Its vertical axis is Height. Colored branches rise from many item labels along the baseline and merge into larger hierarchical groups at increasing heights; dashed outlines indicate lower-level groupings across the tree.
Open full-size chart in a new tab
Chart description
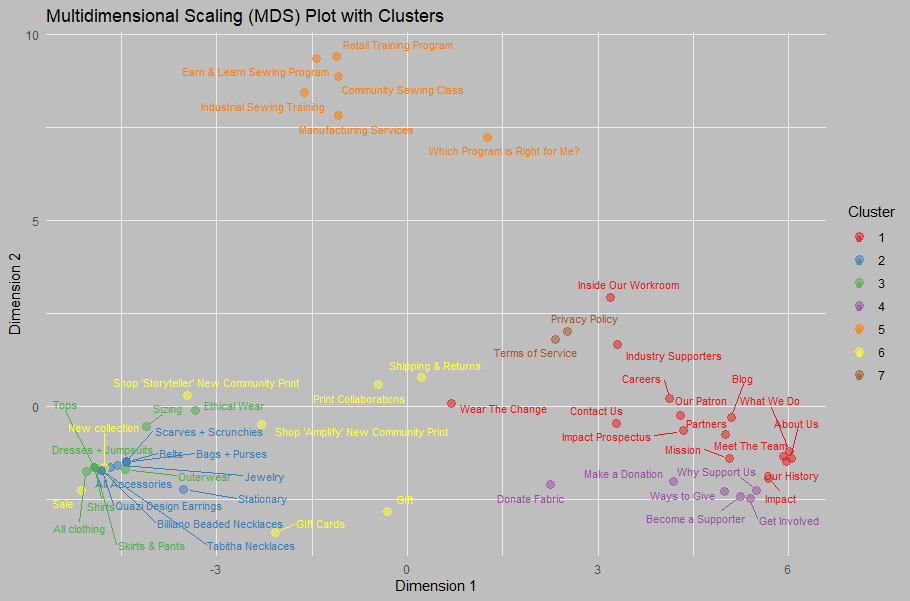
The chart is titled “Multidimensional Scaling (MDS) Plot with Clusters.” The axes are Dimension 1 and Dimension 2. Colored, annotated points span the lower-left, center, and right portions of the plot, with a separate group higher on Dimension 2; the legend at right identifies clusters 1 through 7.