9
Cluster Analysis Results:
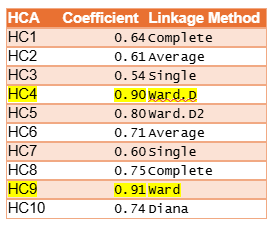
- Selection of Dendrogram: To determine the most representative structure of participant groupings, we conducted HCA using multiple linkage methods. The method that best captured the natural clustering tendencies in this dataset was Ward’s minimum variance method, which minimized the total within-cluster variance and defined compacted clusters. Among the multiple dendrograms generated through HCA, we selected dendrogram hc4. This dendrogram was determined based on the strength of the clustering which had been evaluated using the Agglomerative Coefficient (AC). This yielded a value of 0.90. Since AC values close to 1 indicate strong clustering tendencies, this hc4 dendrogram confirmed that participant responses followed the clearest and most consistent pattern out of our other generated dendrograms.
- Interpretation: The selected dendrogram visually illustrated how participants grouped the content into meaningful clusters. Revealing seven primary clusters, as indicated in Figure 2 below, that will serve as the foundation of structuring for the SocialOutfit website.
Key observations included:
-
The formation of major clusters, indicating strong agreement among participants
regarding certain groupings.
- The presence of smaller, less cohesive clusters may suggest inconsistent terminology, ambiguous labels, or differences in user interpretation.
- Items that frequently appeared together across participant responses, suggested potential category relationships that many structure the websites navigation
Figure 1: Hierarchical Cluster Analysis Results