Who receives my income taxes?
It depends on where you work. If you work in Oakwood, in a township, or in a jurisdiction that does not have a municipal income tax (e.g., Beavercreek), then all of your 2.5% local taxes go to Oakwood. If you work in a jurisdiction with a municipal income tax (e.g., Dayton – 2.5%; Moraine – 2.5%; Kettering – 2.25%; Centerville – 2.25%), then most of your local tax goes to the other communities. Oakwood had historically given full credit for local taxes paid to another jurisdiction. City Council took legislative action at the January 2, 2018 council meeting to reduce the credit from 100% to 90%.
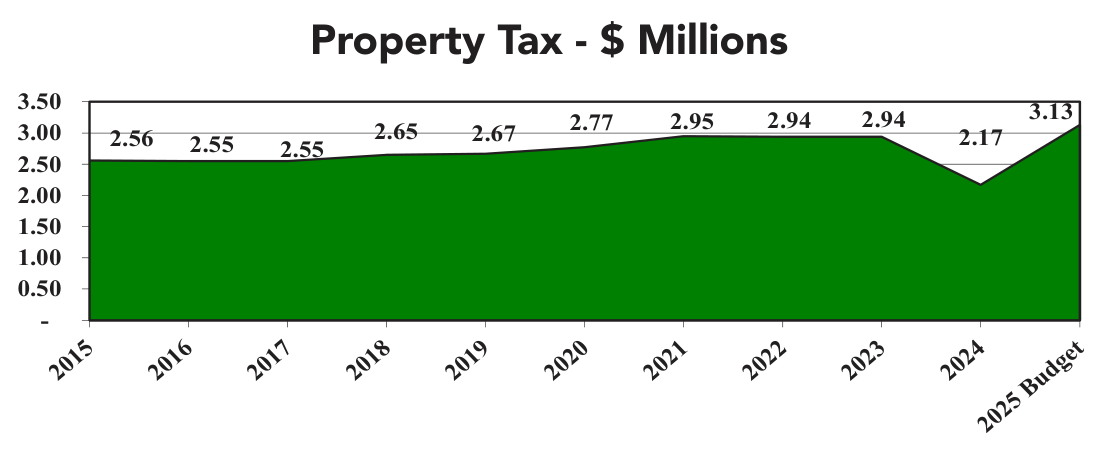
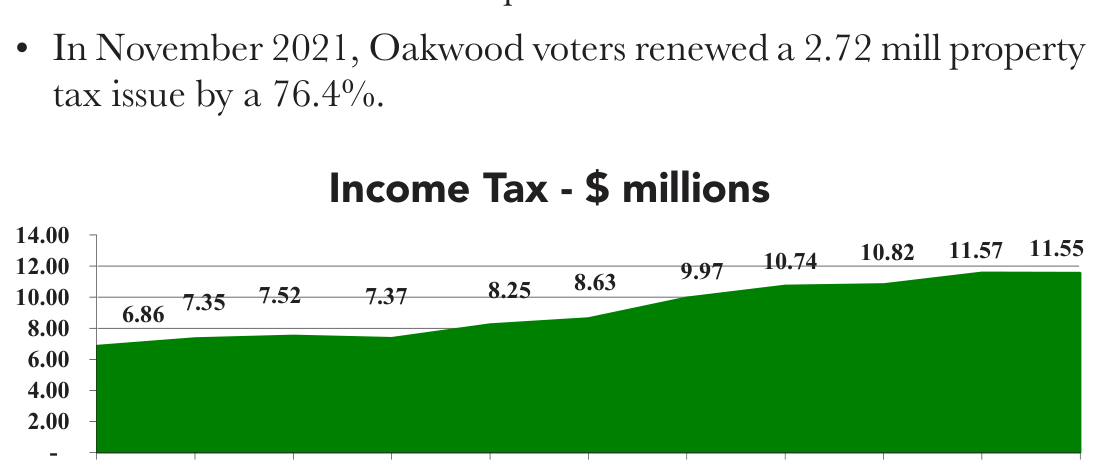
Have the property and income taxes that go to the city and pay for city services changed much in the past 10 years?
Accessible view
Annual Property Tax collections in millions of dollars:
| Year | Property Tax ($ Millions) |
|---|---|
| 2015 | 2.56 |
| 2016 | 2.55 |
| 2017 | 2.55 |
| 2018 | 2.65 |
| 2019 | 2.67 |
| 2020 | 2.77 |
| 2021 | 2.95 |
| 2022 | 2.94 |
| 2023 | 2.94 |
| 2024 | 2.17 |
| 2025 Budget | 3.13 |
- The 3.75 mill property tax issue had been slated for renewal on the November 7, 2023 ballot, but due to a clerical error, it was not on the ballot. That property tax issue generated $1.15 million in revenue. The issue was approved on the March 19, 2024 ballot at 2.41 mills. At the reduced mills, the issue will generate the same amount of revenue as the expired 3.75 mill issue.
- In November 2021, Oakwood voters renewed a 2.72 mill property tax issue by a 76.4%.
Accessible view
Annual Income Tax collections in millions of dollars:
| Year | Income Tax ($ Millions) |
|---|---|
| 2015 | 6.86 |
| 2016 | 7.35 |
| 2017 | 7.52 |
| 2018 | 7.37 |
| 2019 | 8.25 |
| 2020 | 8.63 |
| 2021 | 9.97 |
| 2022 | 10.74 |
| 2023 | 10.82 |
| 2024 | 11.57 |
| 2025 Budget | 11.55 |
What has been our rate of growth in spending over the years?
In 1991, we spent $7.9 million on providing city services. In 2024, we spent $18.2 million. This represents a 3.82% rate of growth. The average annual CPI (inflation) of 2.52% during this 34-year time period. Our growth rate is impacted by annual capital expenditures.
What do we spend our money on?
We spend the largest portion on the delivery of public safety services, followed by public works. Our Public Safety Department is recognized as the finest in the area and the services provided by our Public Works Department are the most comprehensive and responsive around.
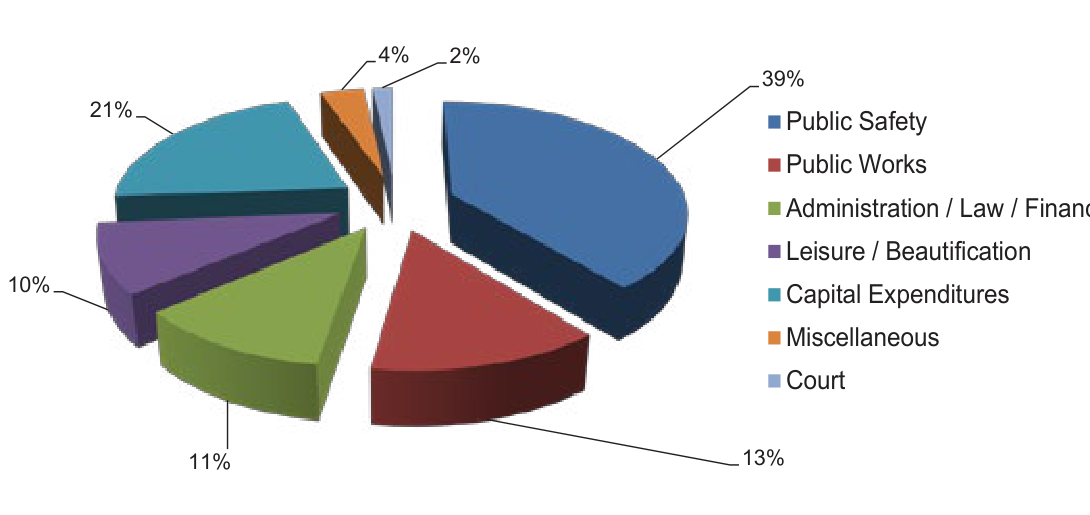
What are the different categories of expenditures incurred by the city, and what percentage of the total was expended in each category for General City Services in 2024?
Accessible view
Expenditure percentages by category for General City Services in 2024:
| Category | Percentage (2024) |
|---|---|
| Public Safety | 39% |
| Capital Expenditures | 21% |
| Public Works | 13% |
| Administration / Law / Finance | 11% |
| Leisure / Beautification | 10% |
| Miscellaneous | 4% |
| Court | 2% |
Accessible view
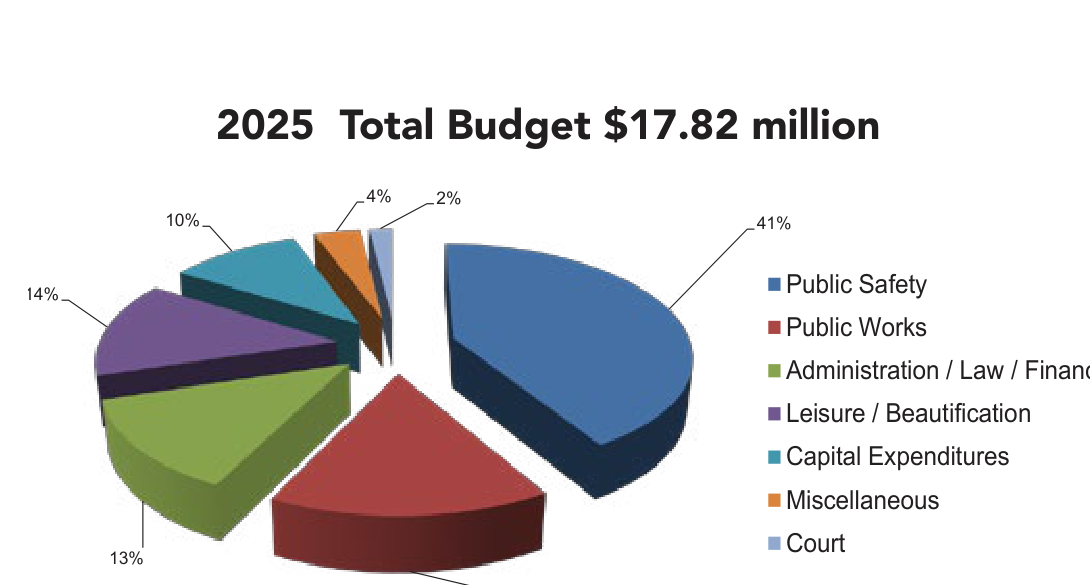
2025 Total Budget ($17.82 million) allocation percentages by category:
| Category | Percentage (2025 Budget) |
|---|---|
| Public Safety | 41% |
| Public Works | 16% |
| Leisure / Beautification | 14% |
| Administration / Law / Finance | 13% |
| Capital Expenditures | 10% |
| Miscellaneous | 4% |
| Court | 2% |
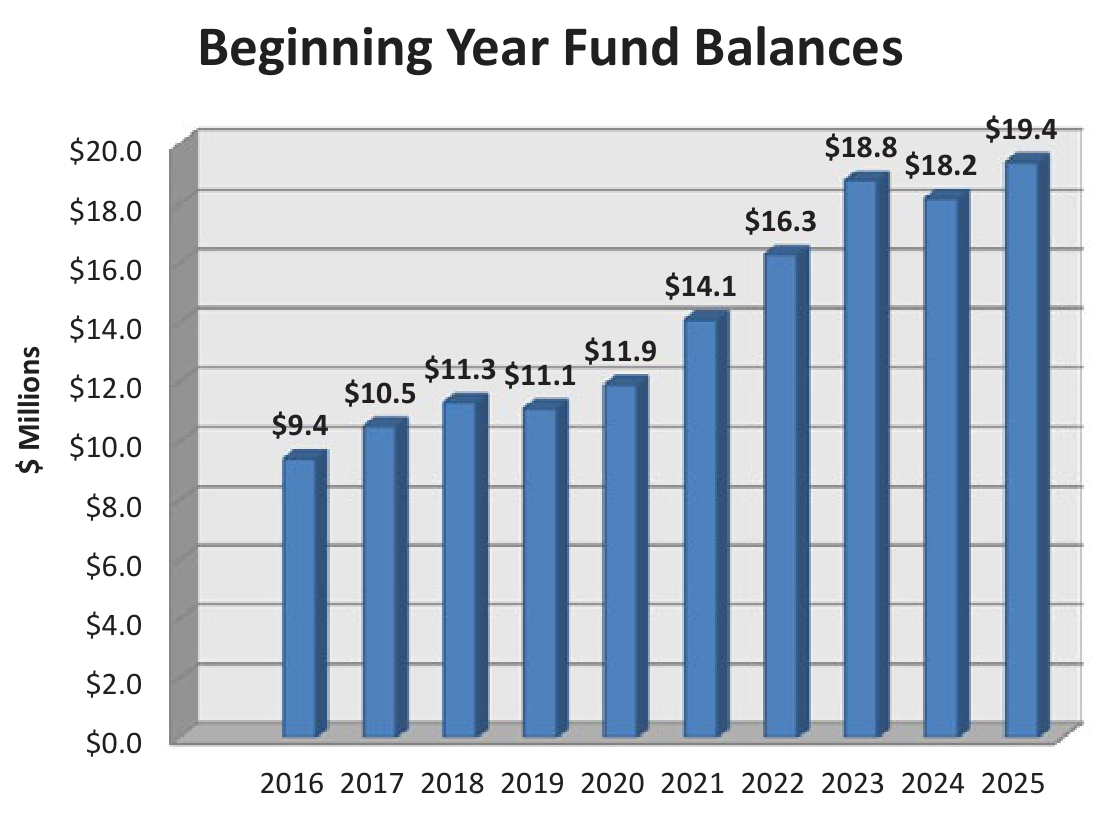
What have been our beginning year balances in the General City Services funds over the past ten years?
Accessible view
Beginning Year Fund Balances in General City Services funds ($ Millions):
| Year | Fund Balance ($ Millions) |
|---|---|
| 2016 | $9.4 |
| 2017 | $10.5 |
| 2018 | $11.3 |
| 2019 | $11.1 |
| 2020 | $11.9 |
| 2021 | $14.1 |
| 2022 | $16.3 |
| 2023 | $18.8 |
| 2024 | $18.2 |
| 2025 | $19.4 |