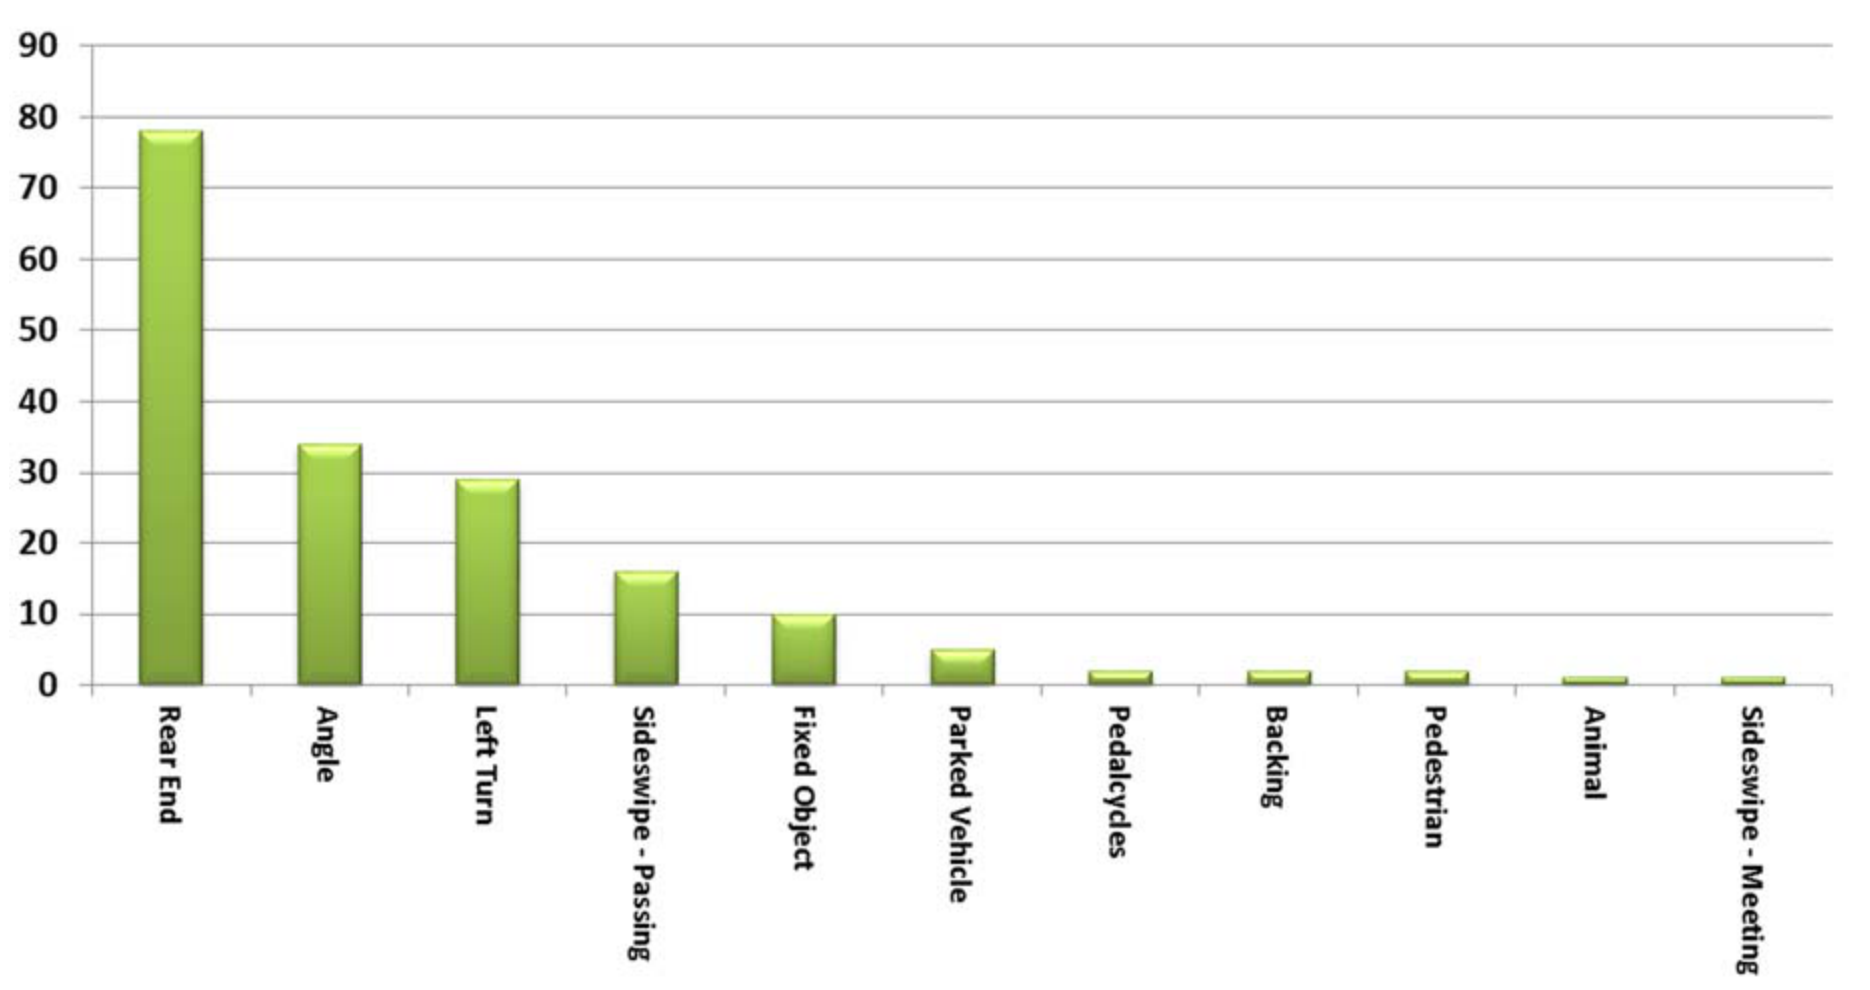
No fatalities occurred within the 5-year study period. Rear end, angle, and left turn crashes represent the top 3 crash types, accounting for over 78 percent of the total crashes as shown in Graph #3. Pedestrian and bicycle crashes (4 crashes) resulted in 3 injuries.
GRAPH #3: FREQUENCY OF CRASHES BY TYPE
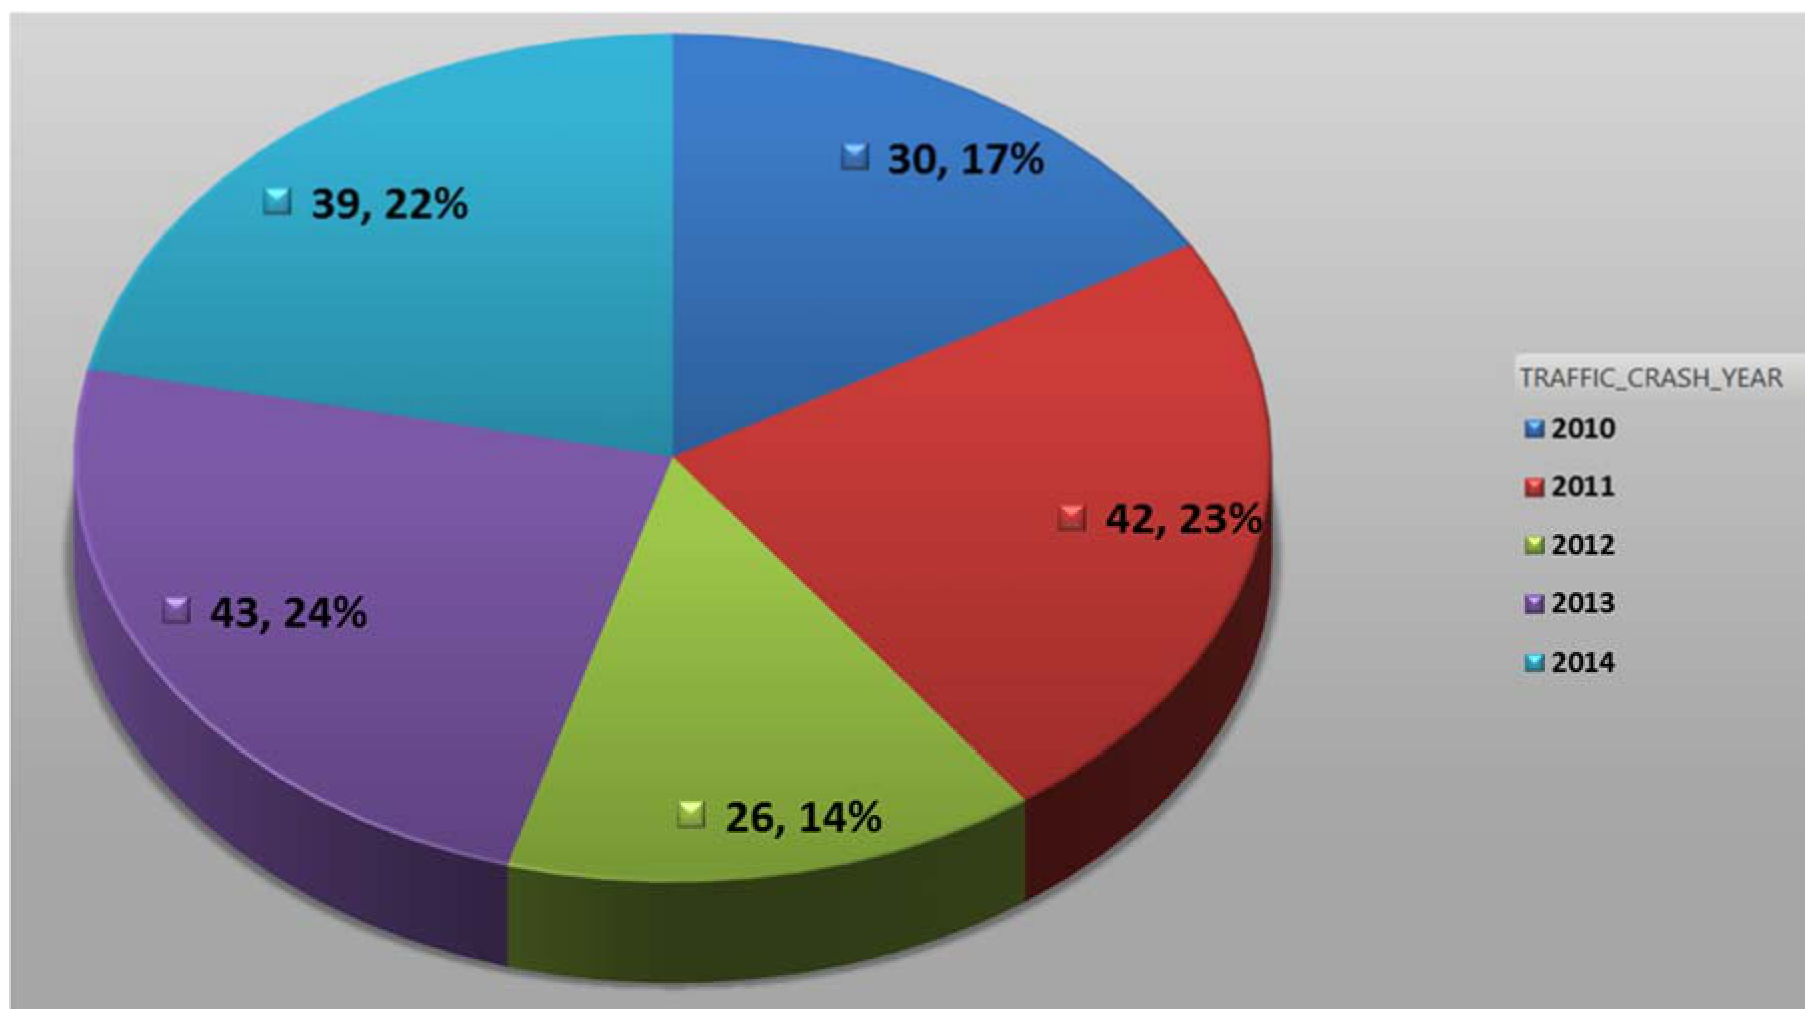
Graph #4 shows the frequency of crashes by year. The percentage of crashes involving serious and minor visible injuries were the highest in 2013 (16 crashes or 37 percent) and 2014 (10 crashes or 26 percent). The total injury crashes within the study area is higher (26.7 percent) than the statewide average (23.5 percent) for similar corridors.
GRAPH #4: FREQUENCY OF CRASHES BY YEAR