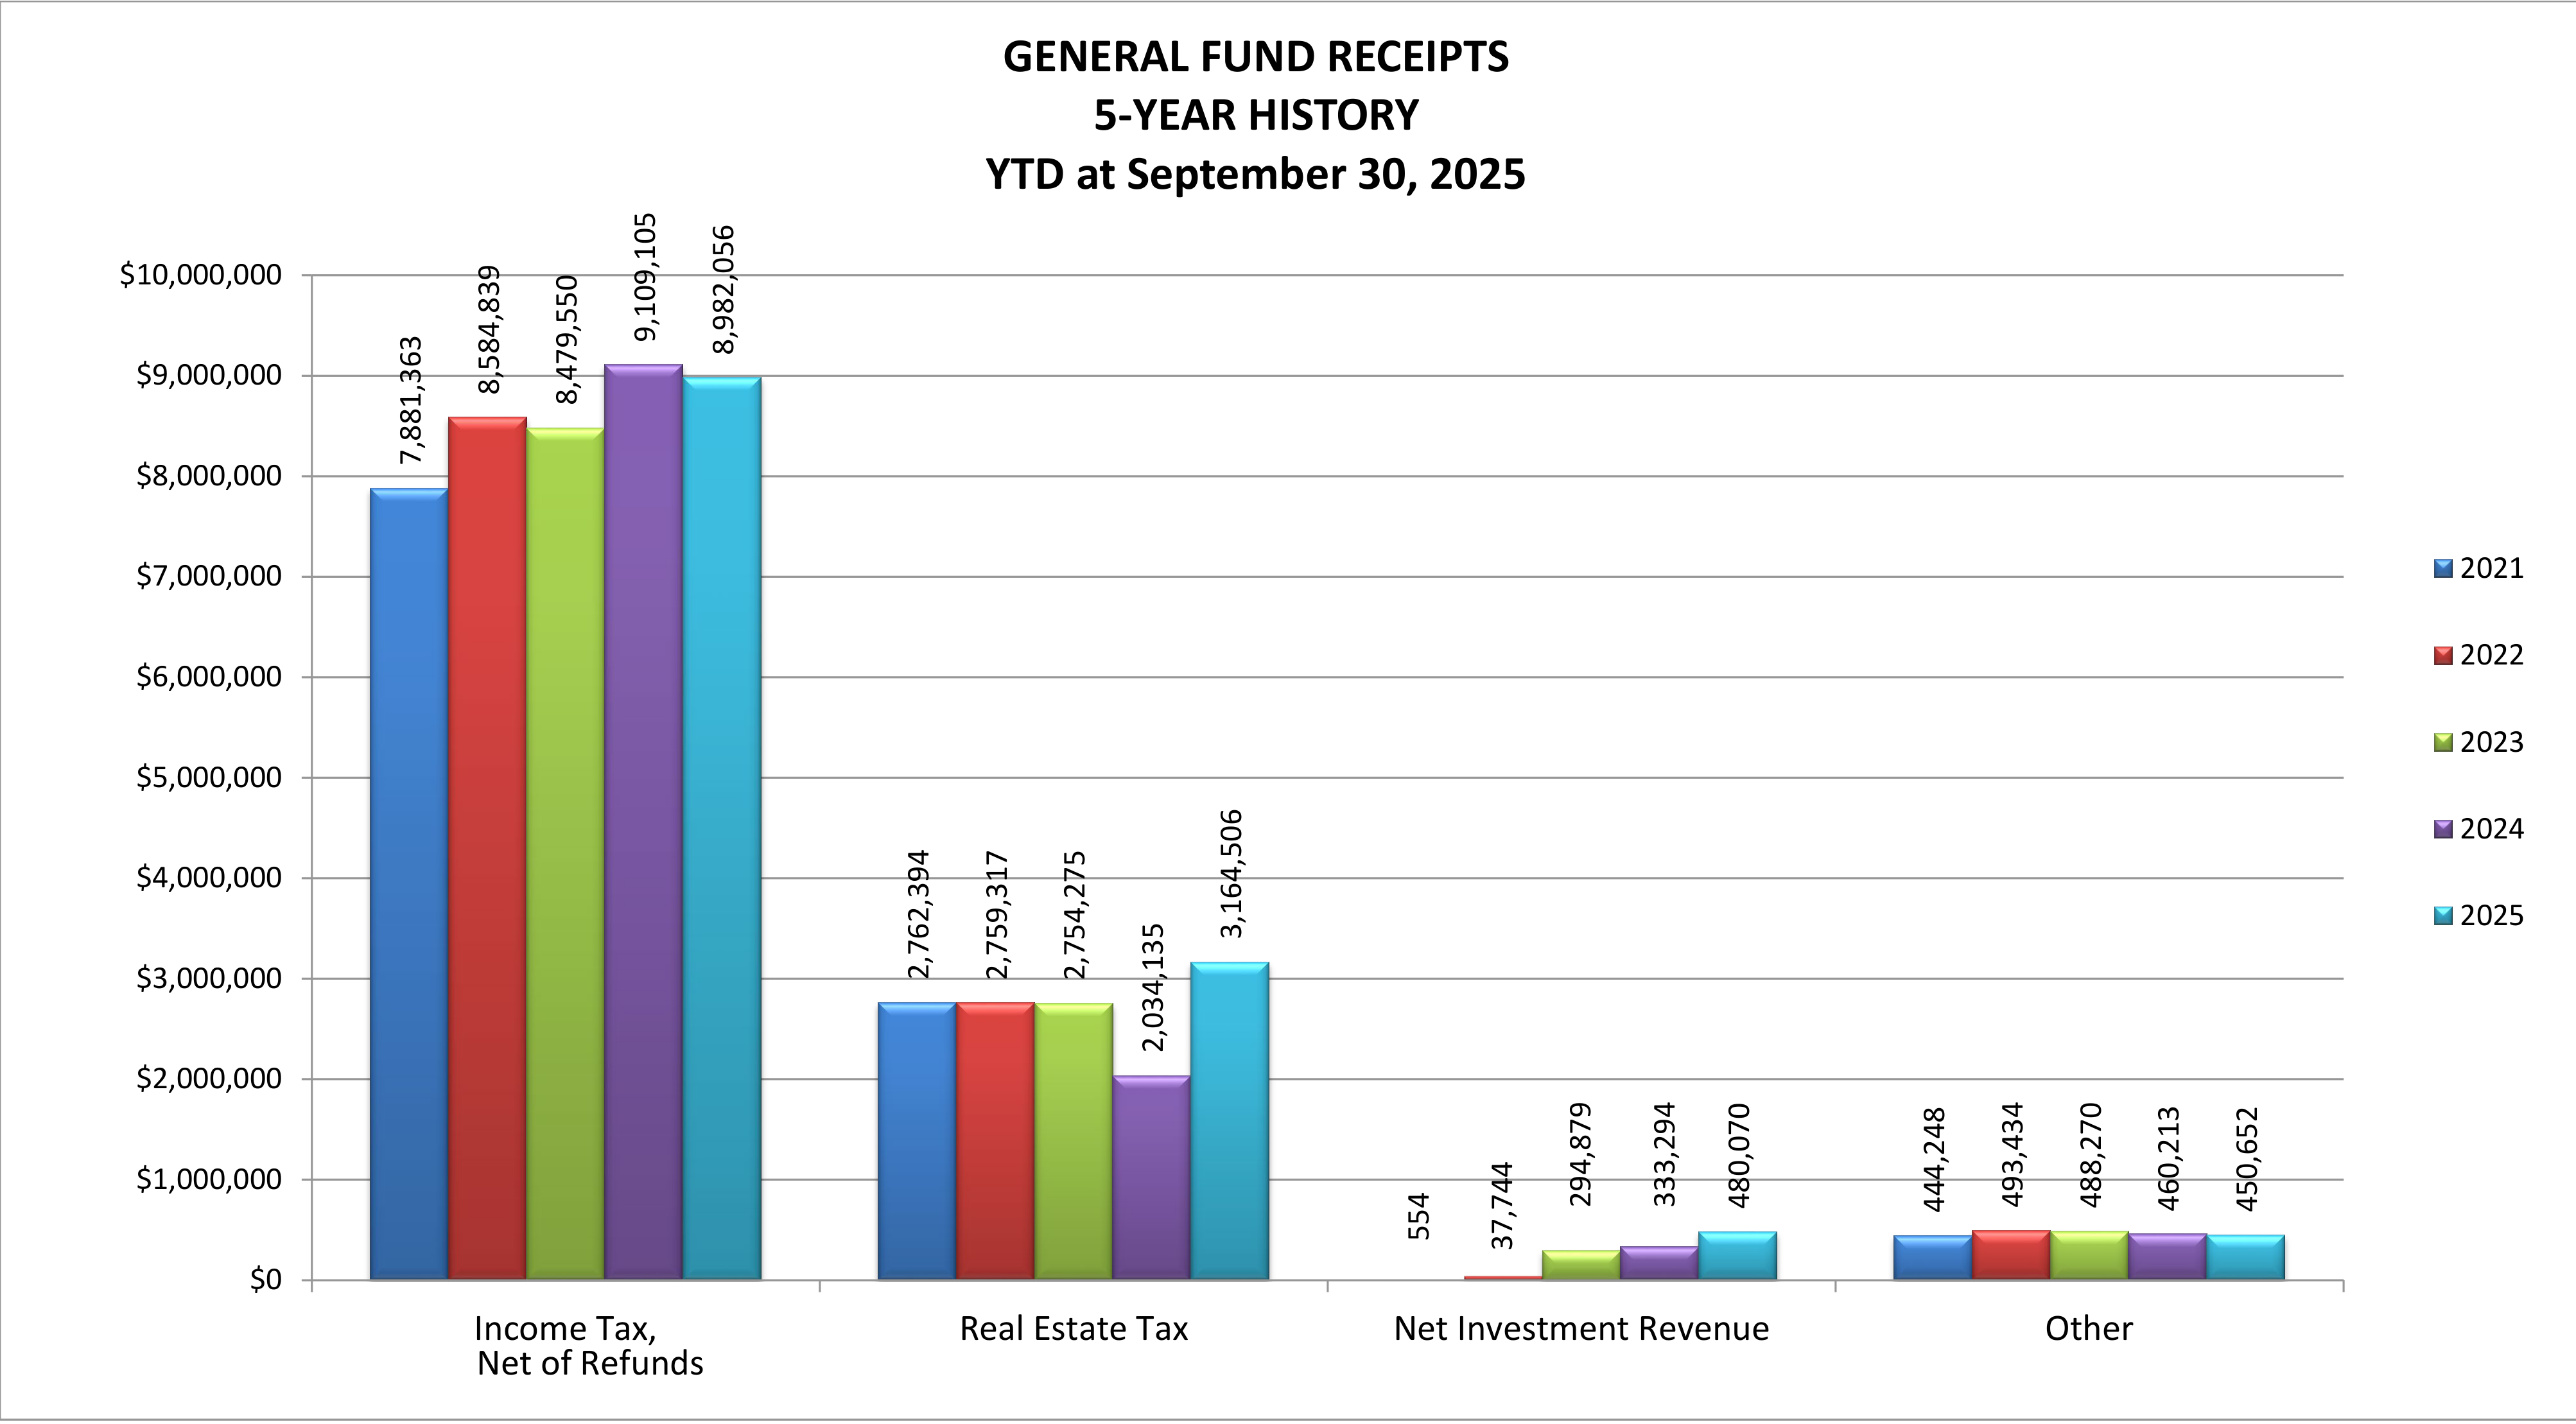
GENERAL FUND RECEIPTS - 5-YEAR HISTORY - YTD at September 30, 2025
Accessible view
Summary: Comparison of Year-To-Date (YTD) General Fund Receipts as of September 30 for fiscal years 2021 through 2025 across four major categories: Income Tax (Net of Refunds), Real Estate Tax, Net Investment Revenue, and Other.
Scroll horizontally to view all years →
| Receipt Category | 2021 ($) | 2022 ($) | 2023 ($) | 2024 ($) | 2025 ($) |
|---|---|---|---|---|---|
| Income Tax, Net of Refunds | 7,881,363 | 8,584,839 | 8,479,550 | 9,109,105 | 8,982,056 |
| Real Estate Tax | 2,762,394 | 2,759,317 | 2,754,275 | 2,034,135 | 3,164,506 |
| Net Investment Revenue | 554 | 37,744 | 294,879 | 333,294 | 480,070 |
| Other | 444,248 | 493,434 | 488,270 | 460,213 | 450,652 |