Accessible view
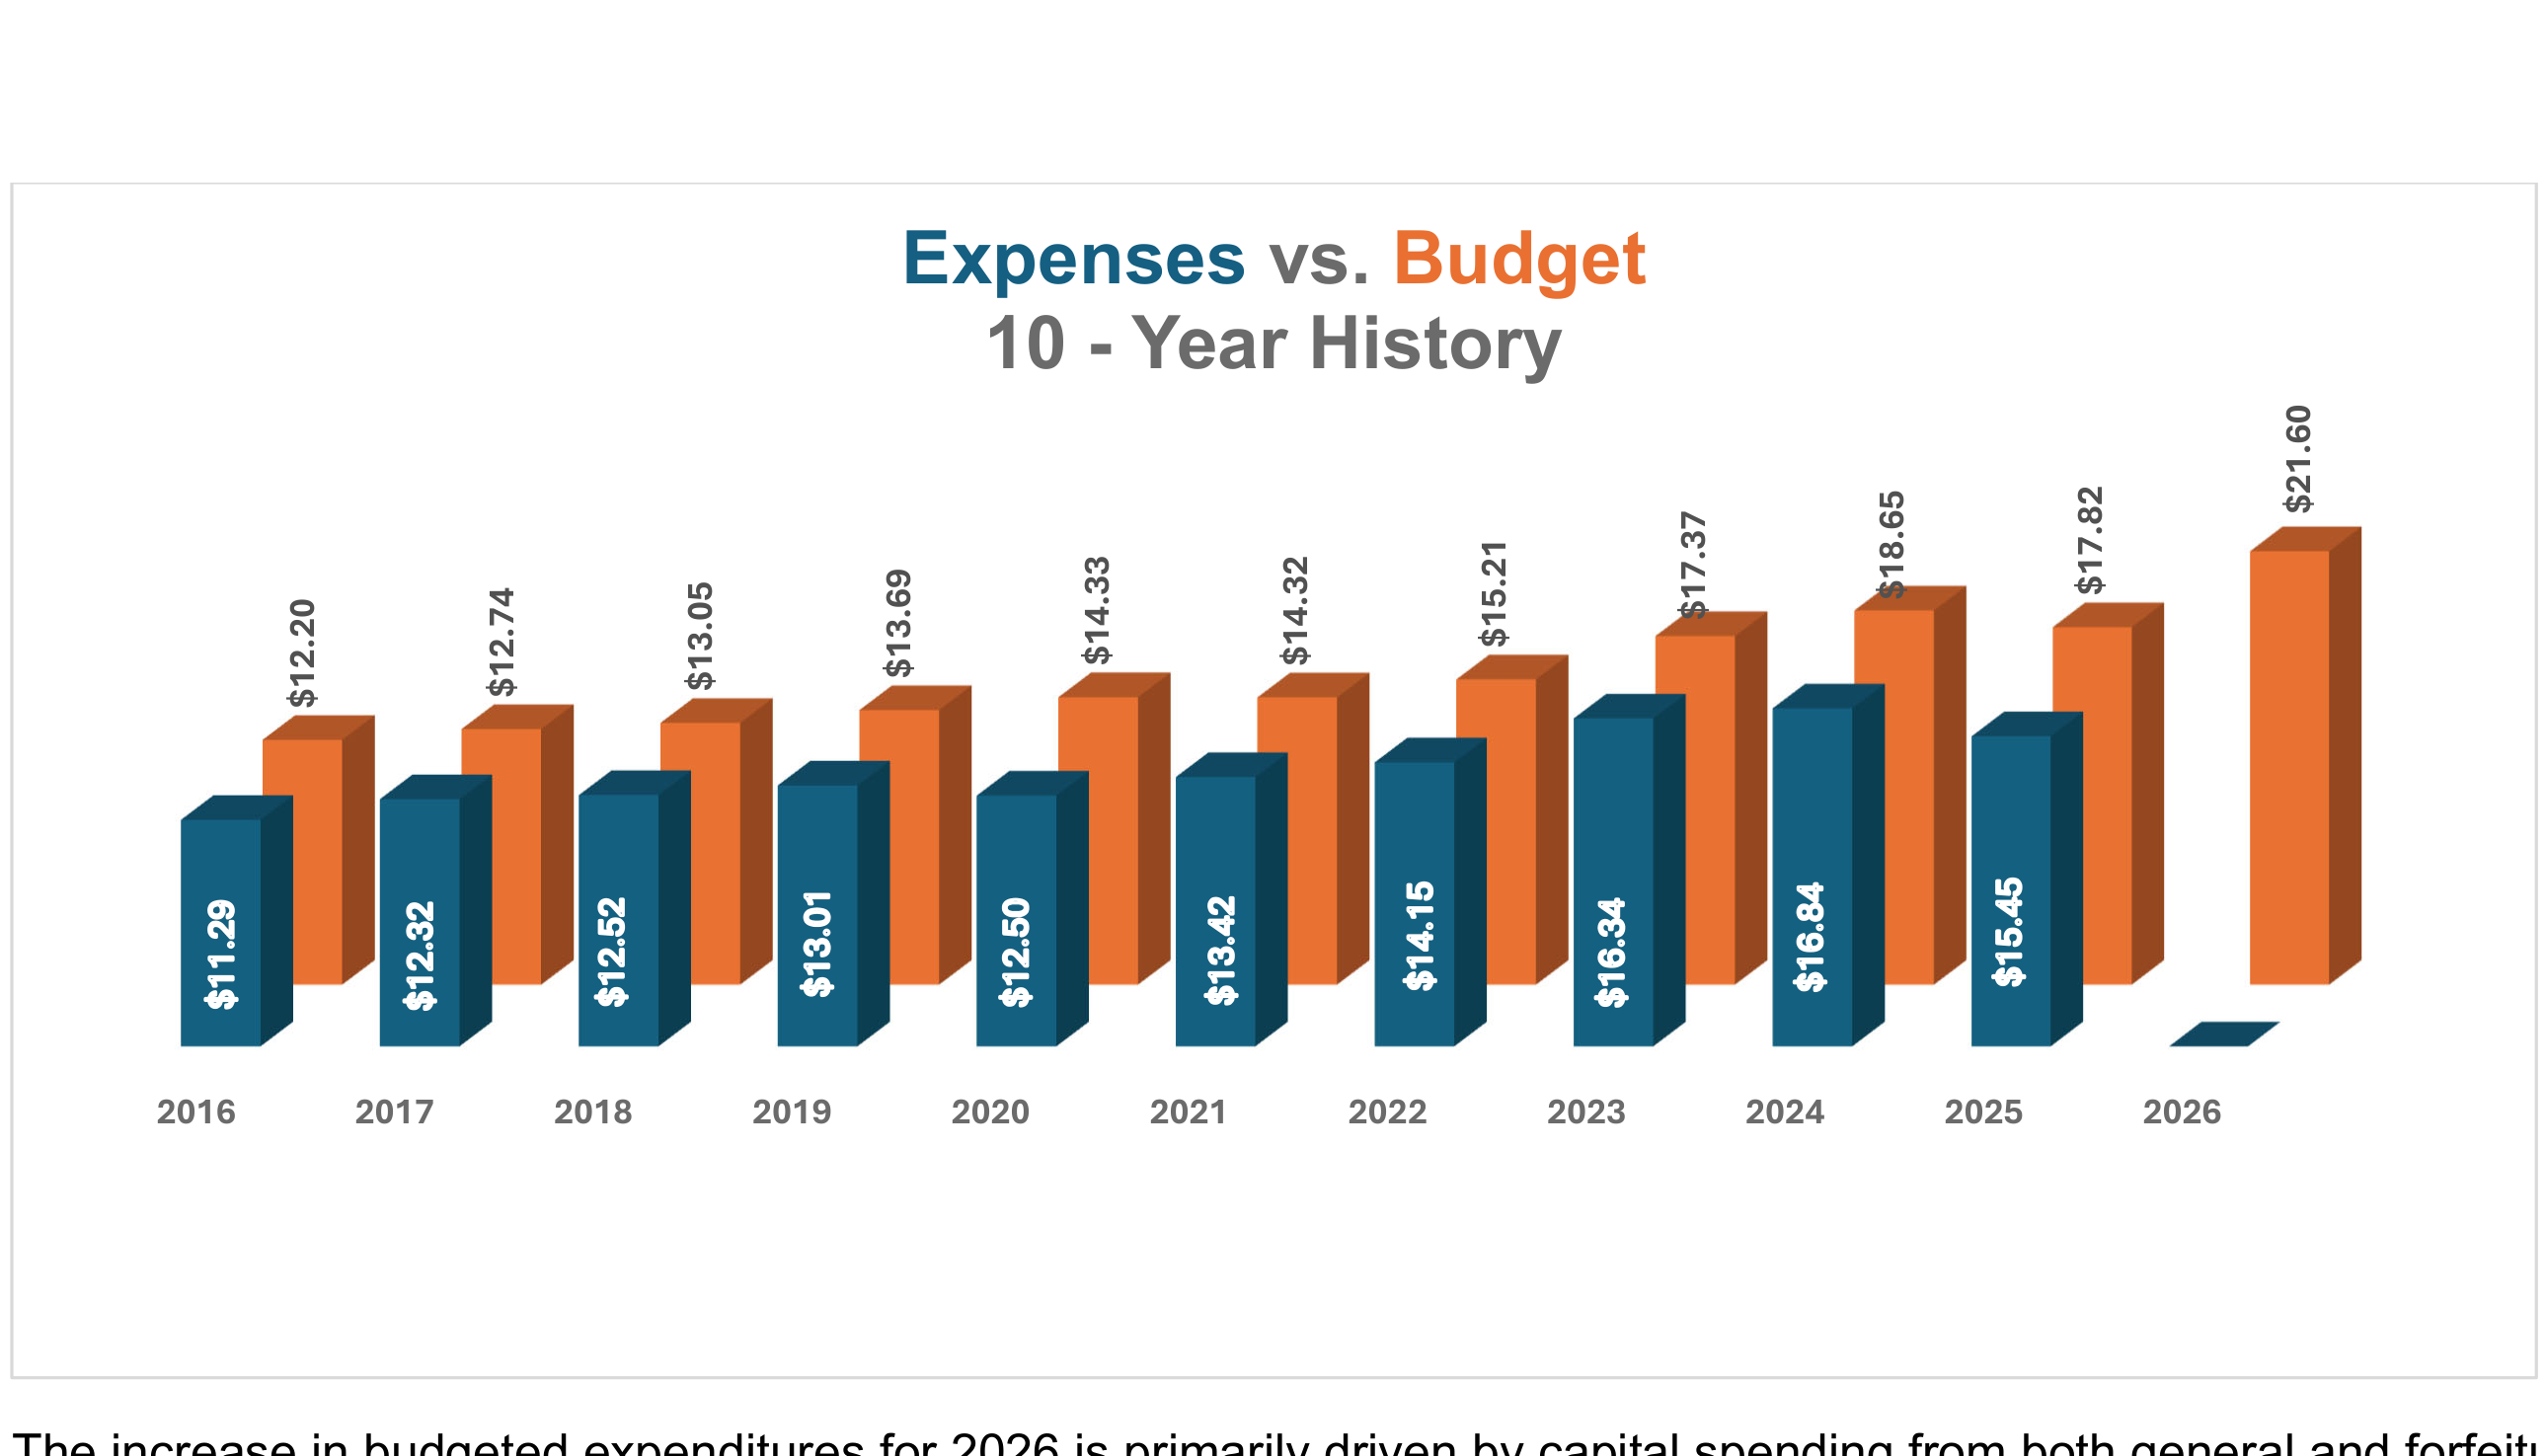
10-Year historical comparison of municipal Expenses versus Budget (in millions of dollars) from 2016 through 2026:
Swipe or scroll horizontally to view all columns.
| Year | Expenses ($) | Budget ($) |
|---|---|---|
| 2016 | $11.29 | $12.20 |
| 2017 | $12.32 | $12.74 |
| 2018 | $12.52 | $13.05 |
| 2019 | $13.01 | $13.69 |
| 2020 | $12.50 | $14.33 |
| 2021 | $13.42 | $14.32 |
| 2022 | $14.15 | $15.21 |
| 2023 | $16.34 | $17.37 |
| 2024 | $16.84 | $18.65 |
| 2025 | $15.45 | $17.82 |
| 2026 | — | $21.60 |
The increase in budgeted expenditures for 2026 is primarily driven by capital spending from both general and forfeiture funds. Capital expenditures fluctuate year to year and are influenced by large-scale projects such as the Concrete Street Program, the Asphalt Street Program, and the Asphalt Rejuvenation Project. In addition, the Parks Playground Renovation Project at Orchardly and Shafor Parks, which began in 2025, will require further investment during the design and construction phases in 2026 and 2027.
The Public Safety Department is also planning the replacement of Engine 27, a Spartan fire truck originally purchased in 1996, with a new fire engine estimated to cost $950,000. While these funds are included in the 2026 capital budget, delivery of the vehicle is not expected until 2027. Finally, an additional $507,000 in forfeiture funds will be used to upgrade various public safety vehicles and dispatcher equipment.