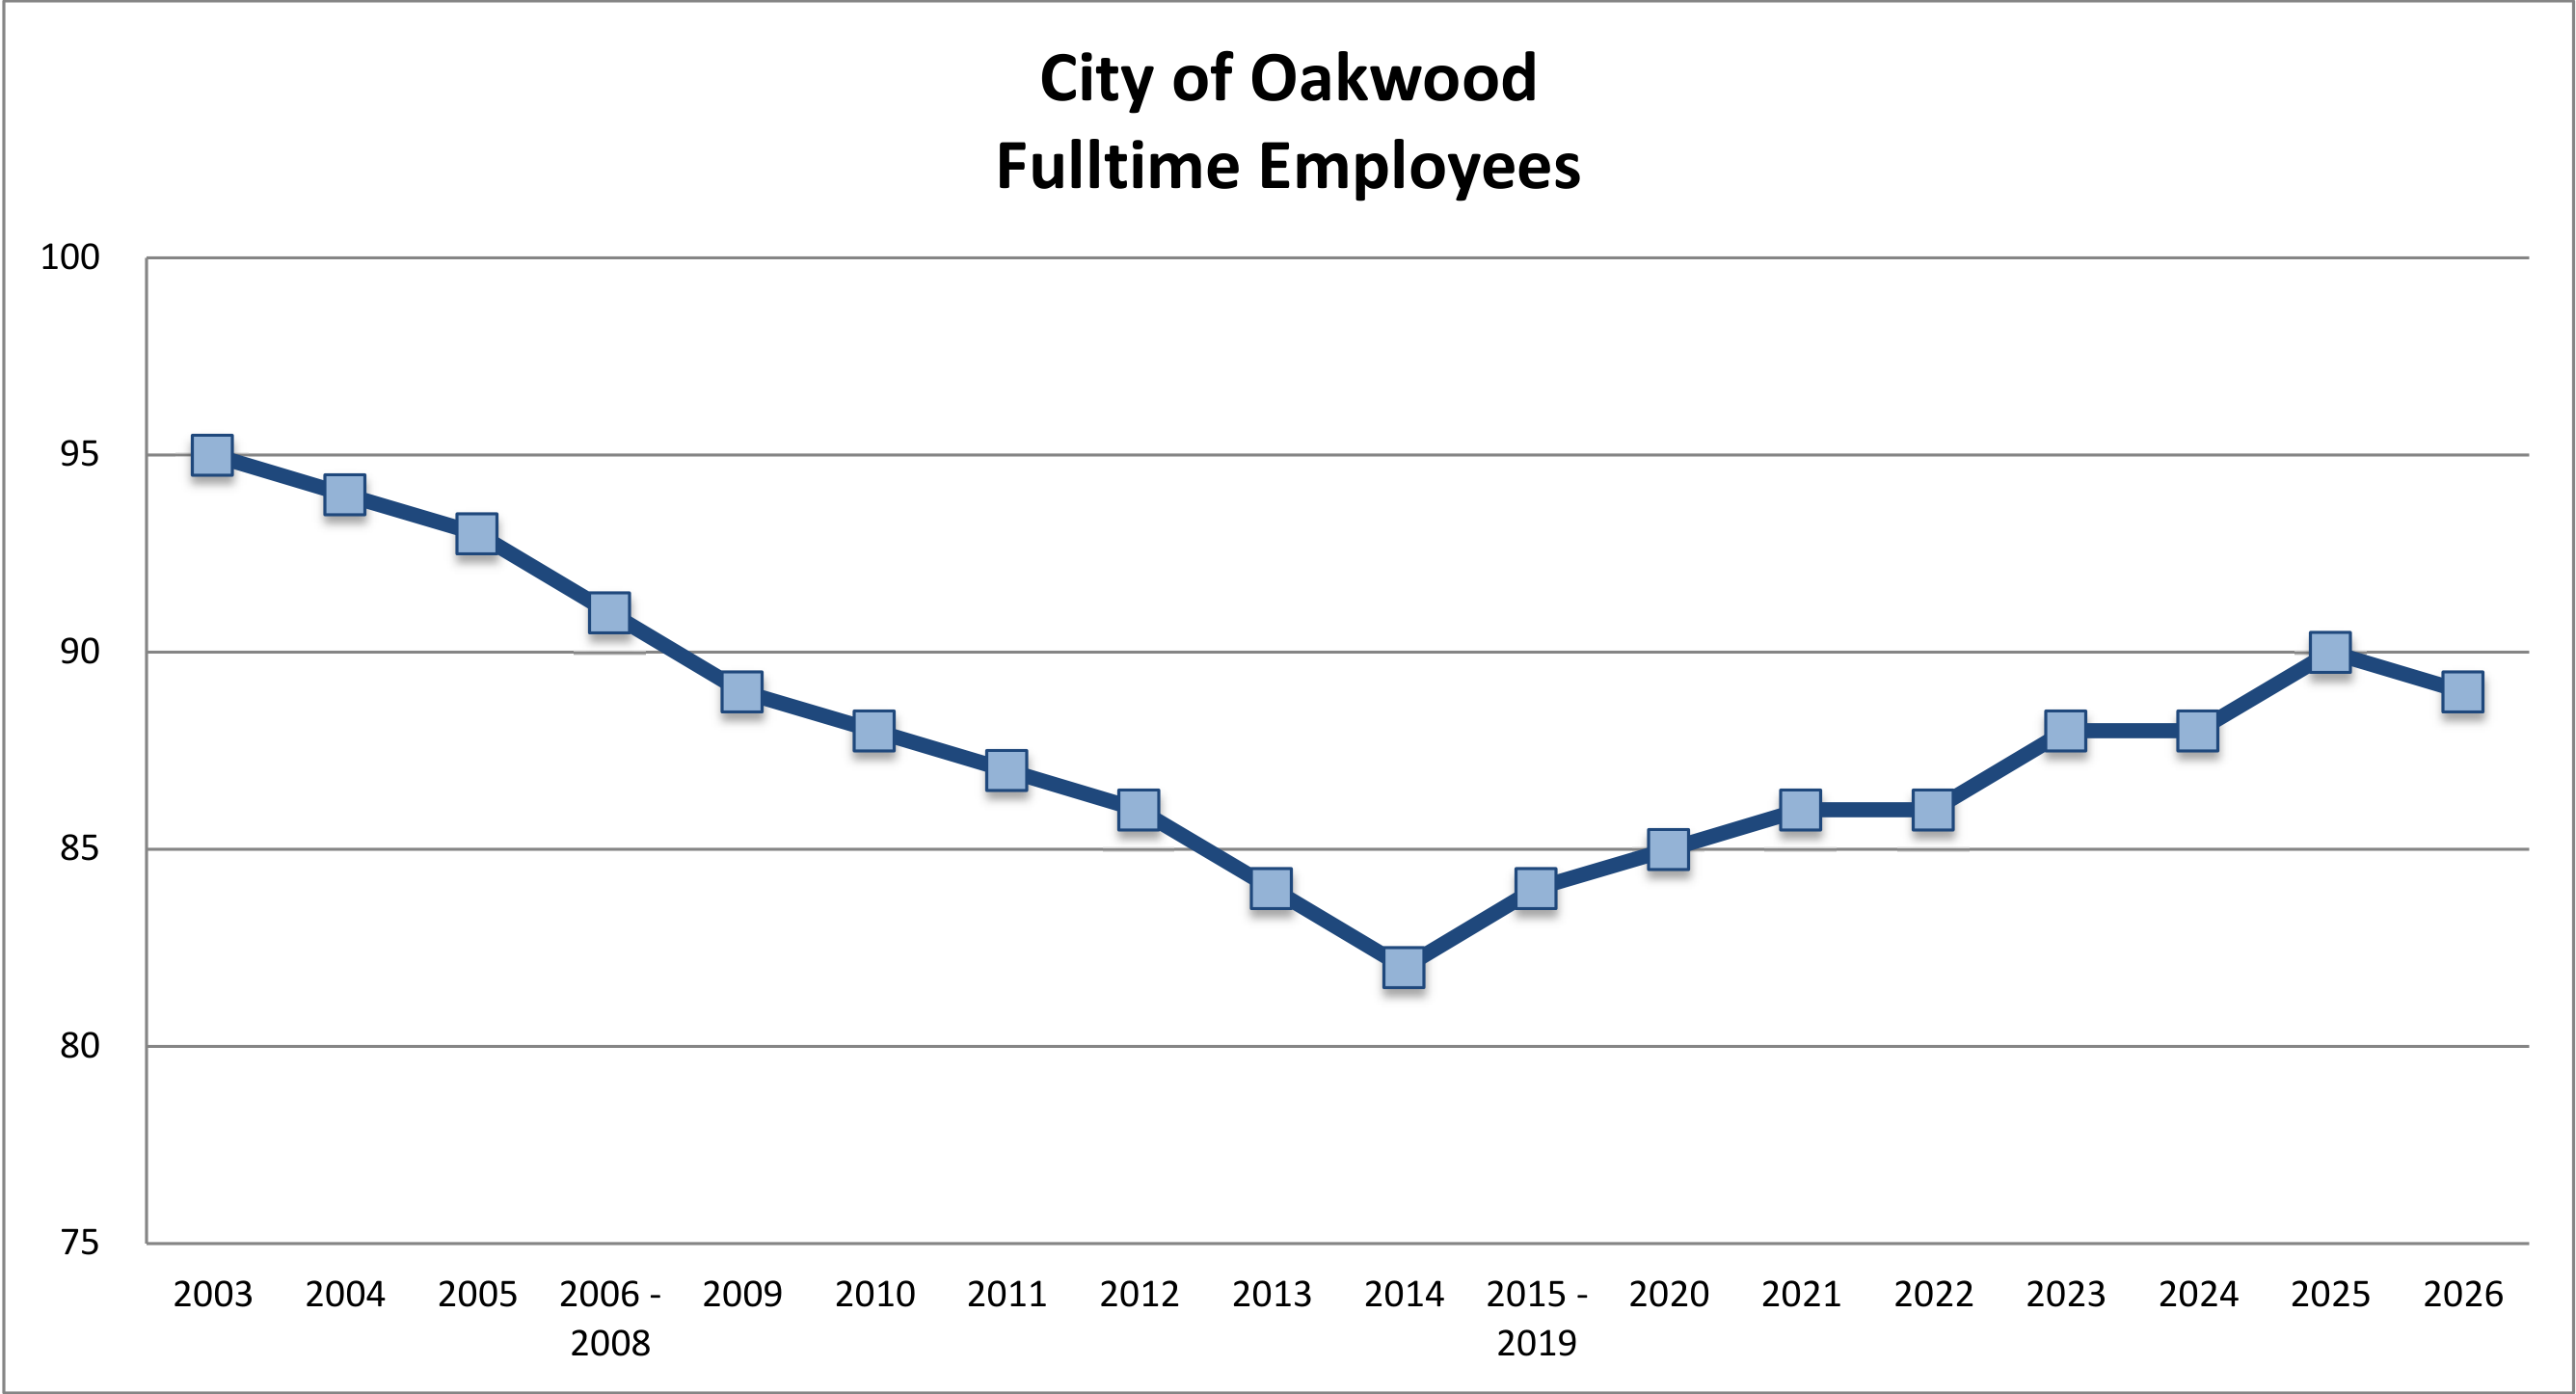
Staff levels were reduced from from 95 in 2003 to 82 in 2014 to reduce operating costs. From 2014 to 2025, staffing levels increased by six positions to address operational needs. During the 2025 Organizational Assessement, several vacant positions were evalutated for strategic realignment to better meet the operational needs of the City and departmental workloads.
Accessible view
Chart Data: City of Oakwood Fulltime Employees (2003–2026)
| Year | Fulltime Employees |
|---|---|
| 2003 | 95 |
| 2004 | 94 |
| 2005 | 93 |
| 2006 - 2008 | 91 |
| 2009 | 89 |
| 2010 | 88 |
| 2011 | 87 |
| 2012 | 86 |
| 2013 | 84 |
| 2014 | 82 |
| 2015 - 2019 | 84 |
| 2020 | 85 |
| 2021 | 86 |
| 2022 | 86 |
| 2023 | 88 |
| 2024 | 88 |
| 2025 | 90 |
| 2026 | 89 |