General Fund
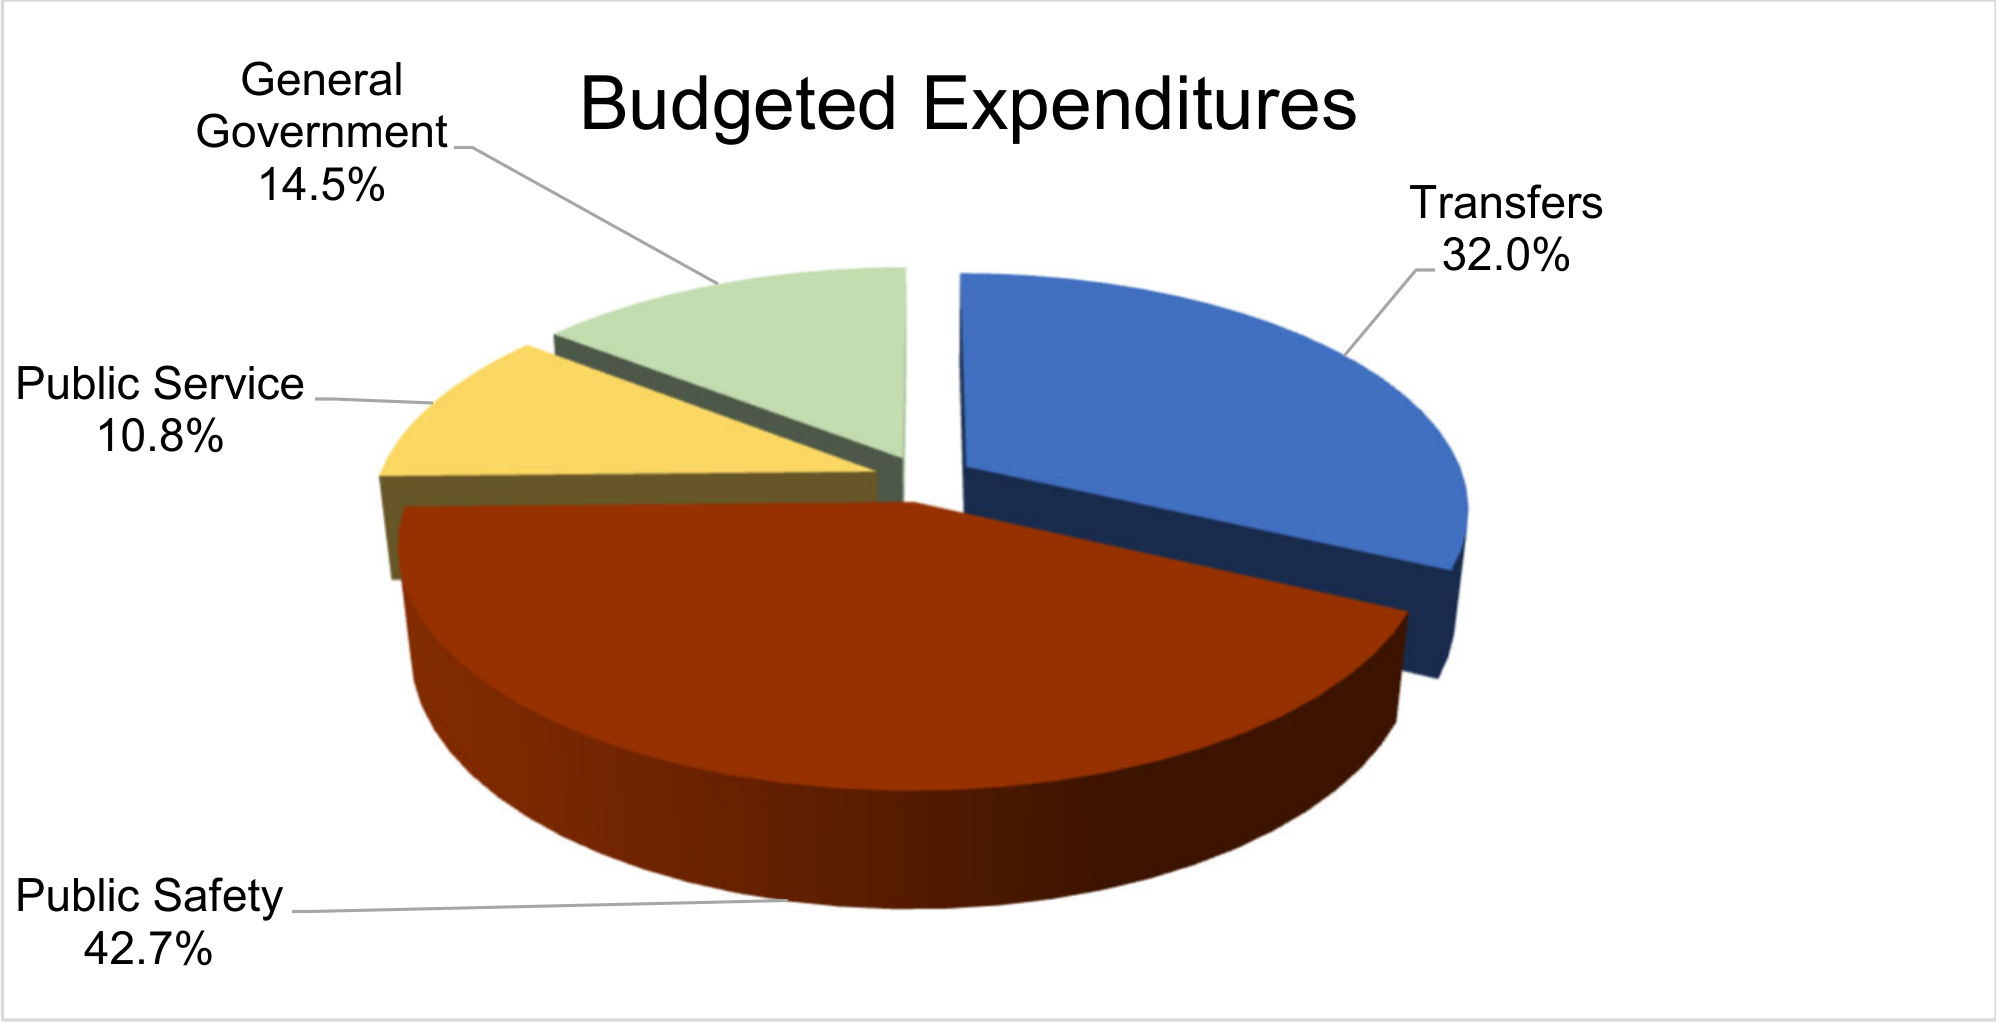
Budgeted Expenditures
Accessible view
Swipe or scroll horizontally to view all columns.
| Category | Percentage |
|---|---|
| Public Safety | 42.7% |
| Transfers | 32.0% |
| General Government | 14.5% |
| Public Service | 10.8% |
More than any other fund, the General Fund supports overall operations and direct governmental services to the community. In order to better track certain services, additional funds have been created and are supported by transfers from the General Fund.
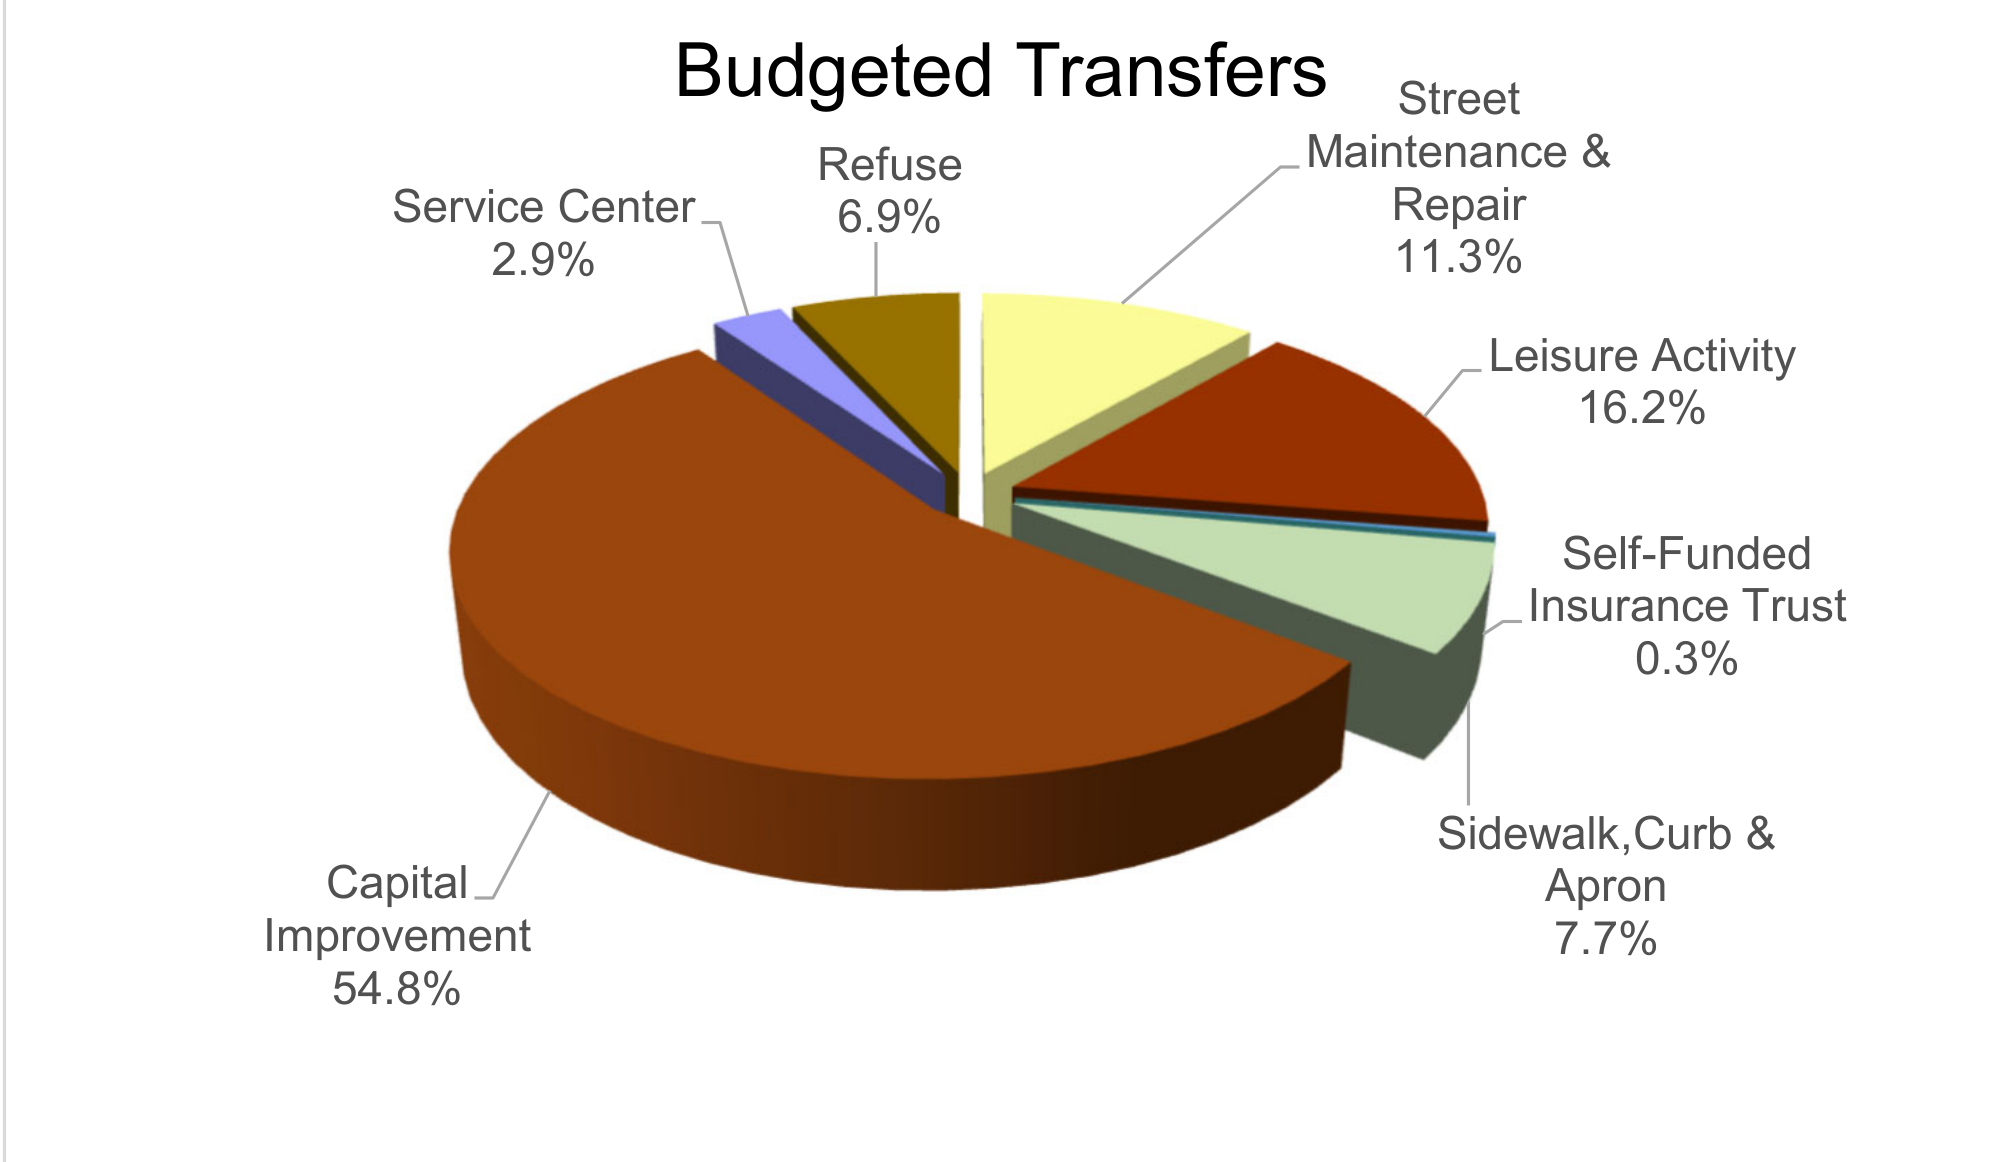
Budgeted Transfers
Accessible view
Swipe or scroll horizontally to view all columns.
| Category | Percentage |
|---|---|
| Capital Improvement | 54.8% |
| Leisure Activity | 16.2% |
| Street Maintenance & Repair | 11.3% |
| Sidewalk, Curb & Apron | 7.7% |
| Refuse | 6.9% |
| Service Center | 2.9% |
| Self-Funded Insurance Trust | 0.3% |
The transfer account of the General Fund supports other important service activities, particularly those relating to capital improvements, parks and recreation and street maintenance. Some of those activities are also supplemented by user fees, grants and endowments.