Signal Warrant SR 48 and Orchard
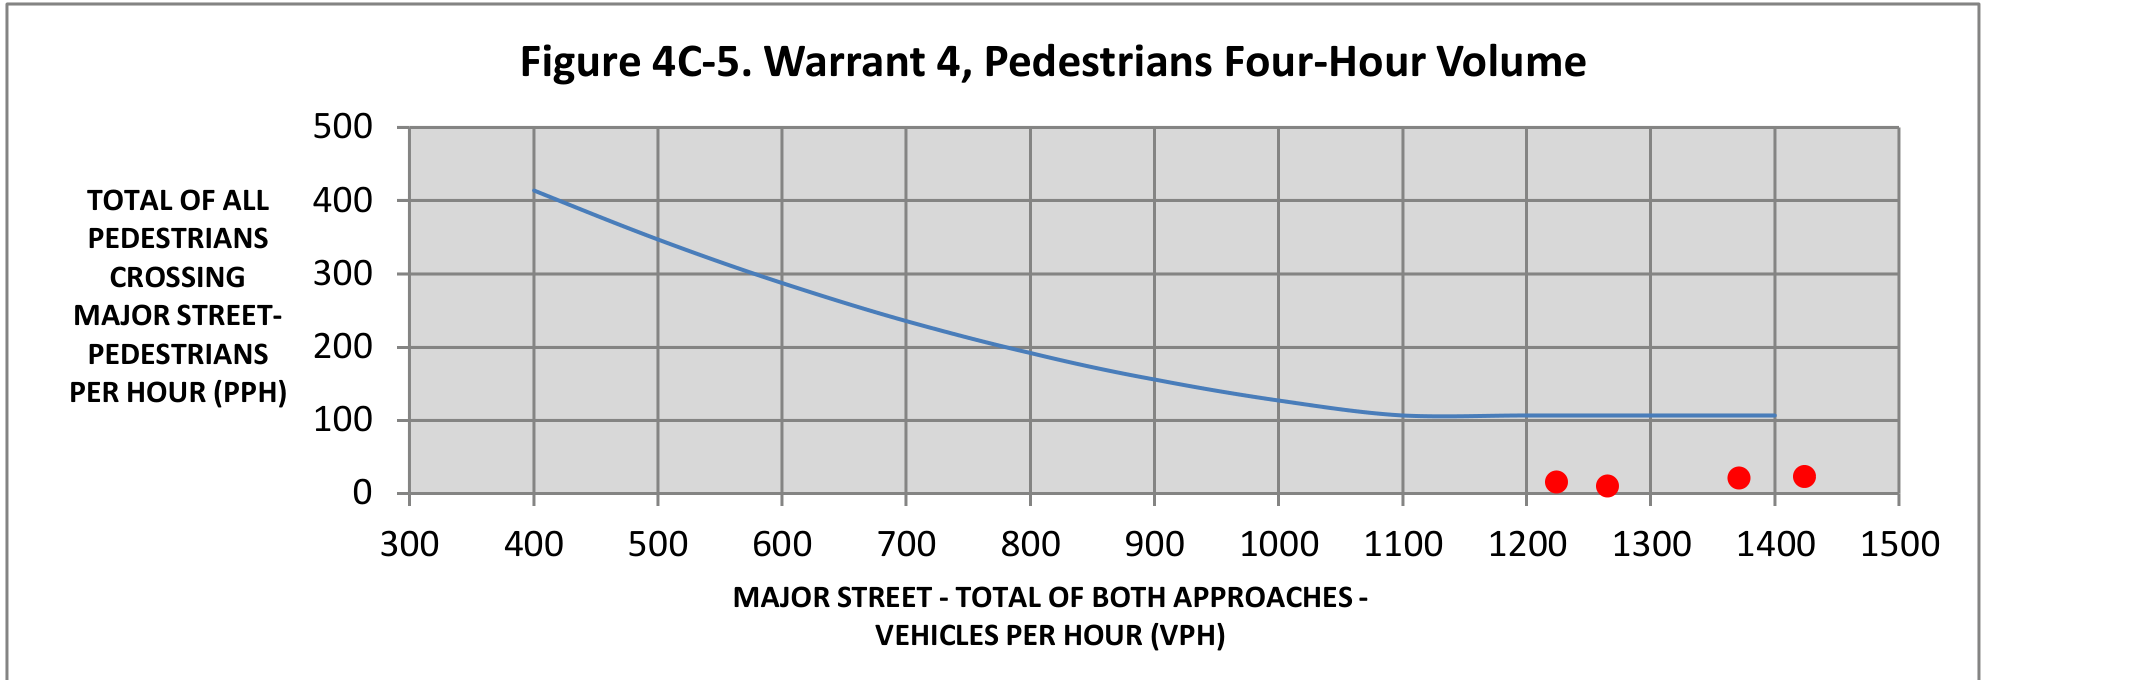
Chart image. On a narrow screen, scroll horizontally for a readable view or activate the image for a larger view. Expand the text equivalent for the chart labels and plotted data.
Text equivalent for Figure 4C-5
Axes: horizontal axis, “MAJOR STREET - TOTAL OF BOTH APPROACHES - VEHICLES PER HOUR (VPH),” from 300 to 1500 VPH; vertical axis, “TOTAL OF ALL PEDESTRIANS CROSSING MAJOR STREET- PEDESTRIANS PER HOUR (PPH),” from 0 to 500 PPH.
Blue threshold curve: begins just above 400 PPH near 400 VPH, declines through the chart, reaches about 100 PPH near 1100 VPH, and then stays nearly level through about 1400 VPH. Red plotted points: four points near the baseline on the right side of the chart, at approximately 1225, 1265, 1370, and 1425 VPH (about 10–25 PPH).
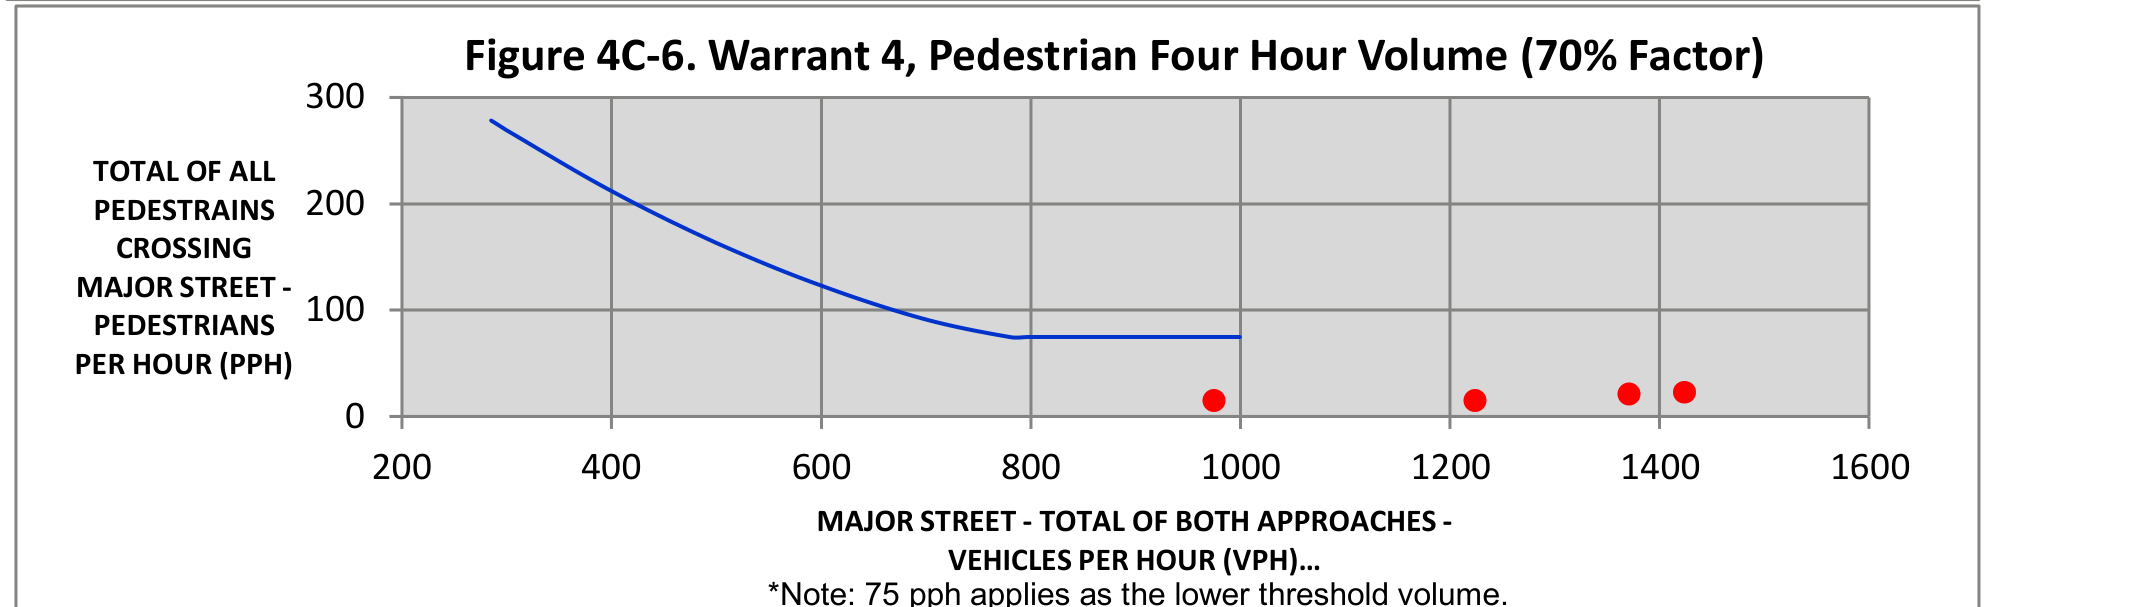
Chart image. On a narrow screen, scroll horizontally for a readable view or activate the image for a larger view. Expand the text equivalent for the chart labels and plotted data.
Text equivalent for Figure 4C-6
Axes: horizontal axis, “MAJOR STREET - TOTAL OF BOTH APPROACHES - VEHICLES PER HOUR (VPH)...,” from 200 to 1600 VPH; vertical axis, “TOTAL OF ALL PEDESTRIANS CROSSING MAJOR STREET - PEDESTRIANS PER HOUR (PPH),” from 0 to 300 PPH.
Blue threshold curve: starts near 280 PPH around 280 VPH, falls to about 75 PPH near 780 VPH, and remains level to about 1000 VPH. Red plotted points: four points near the baseline, around 975, 1225, 1370, and 1425 VPH, with values approximately 10–25 PPH. Note: 75 pph applies as the lower threshold volume.
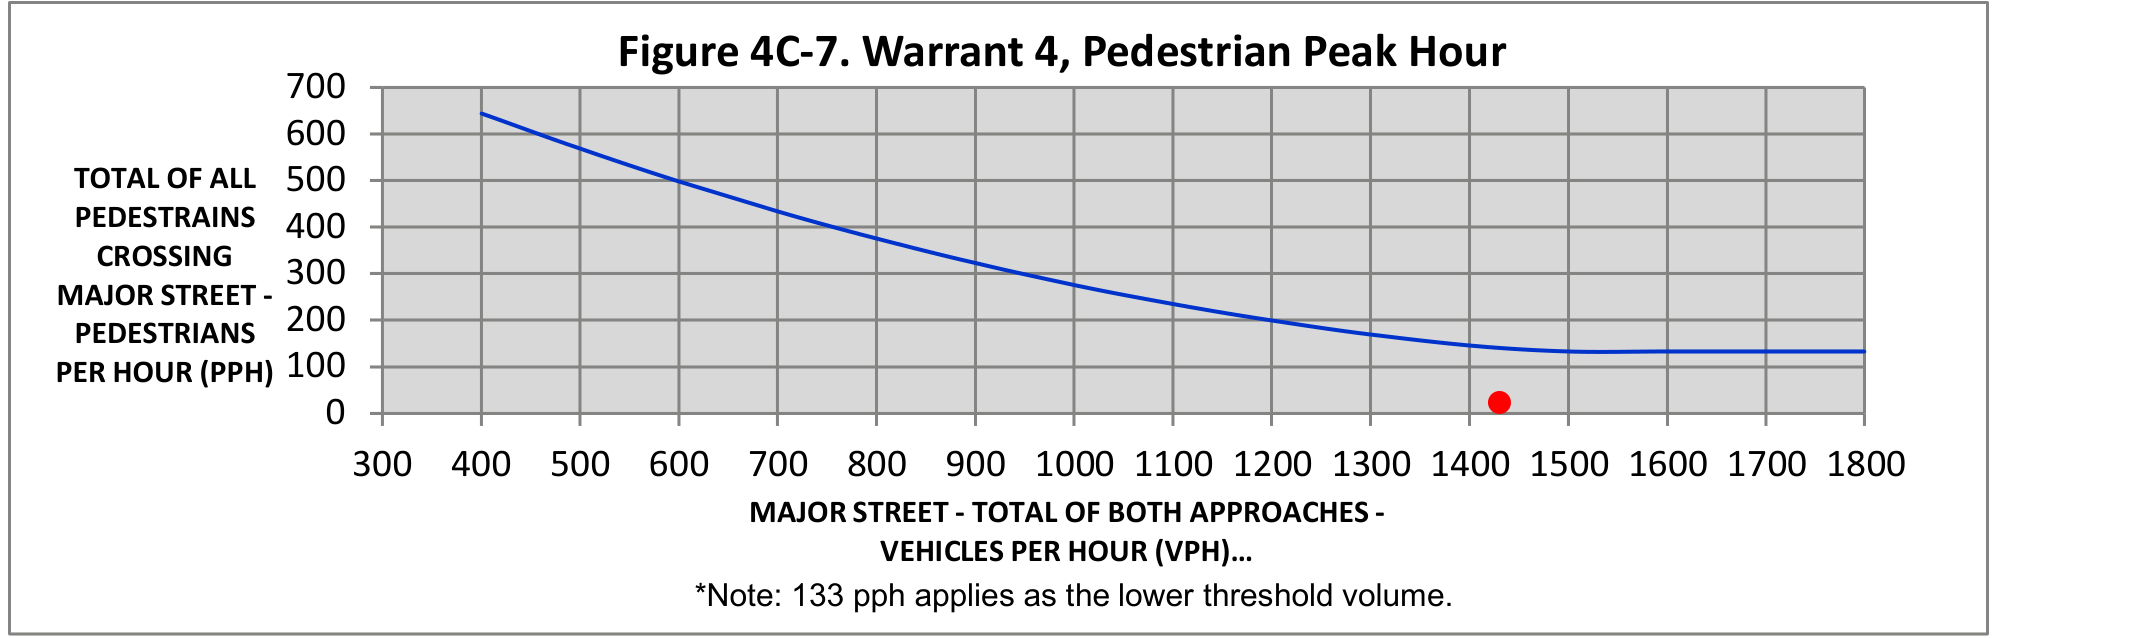
Chart image. On a narrow screen, scroll horizontally for a readable view or activate the image for a larger view. Expand the text equivalent for the chart labels and plotted data.
Text equivalent for Figure 4C-7
Axes: horizontal axis, “MAJOR STREET - TOTAL OF BOTH APPROACHES - VEHICLES PER HOUR (VPH)...,” from 300 to 1800 VPH; vertical axis, “TOTAL OF ALL PEDESTRIANS CROSSING MAJOR STREET - PEDESTRIANS PER HOUR (PPH),” from 0 to 700 PPH.
Blue threshold curve: begins near 640 PPH around 400 VPH, declines to about 130 PPH around 1500 VPH, and remains nearly level through 1800 VPH. Red plotted point: one point near 1430 VPH and about 25 PPH. Note: 133 pph applies as the lower threshold volume.
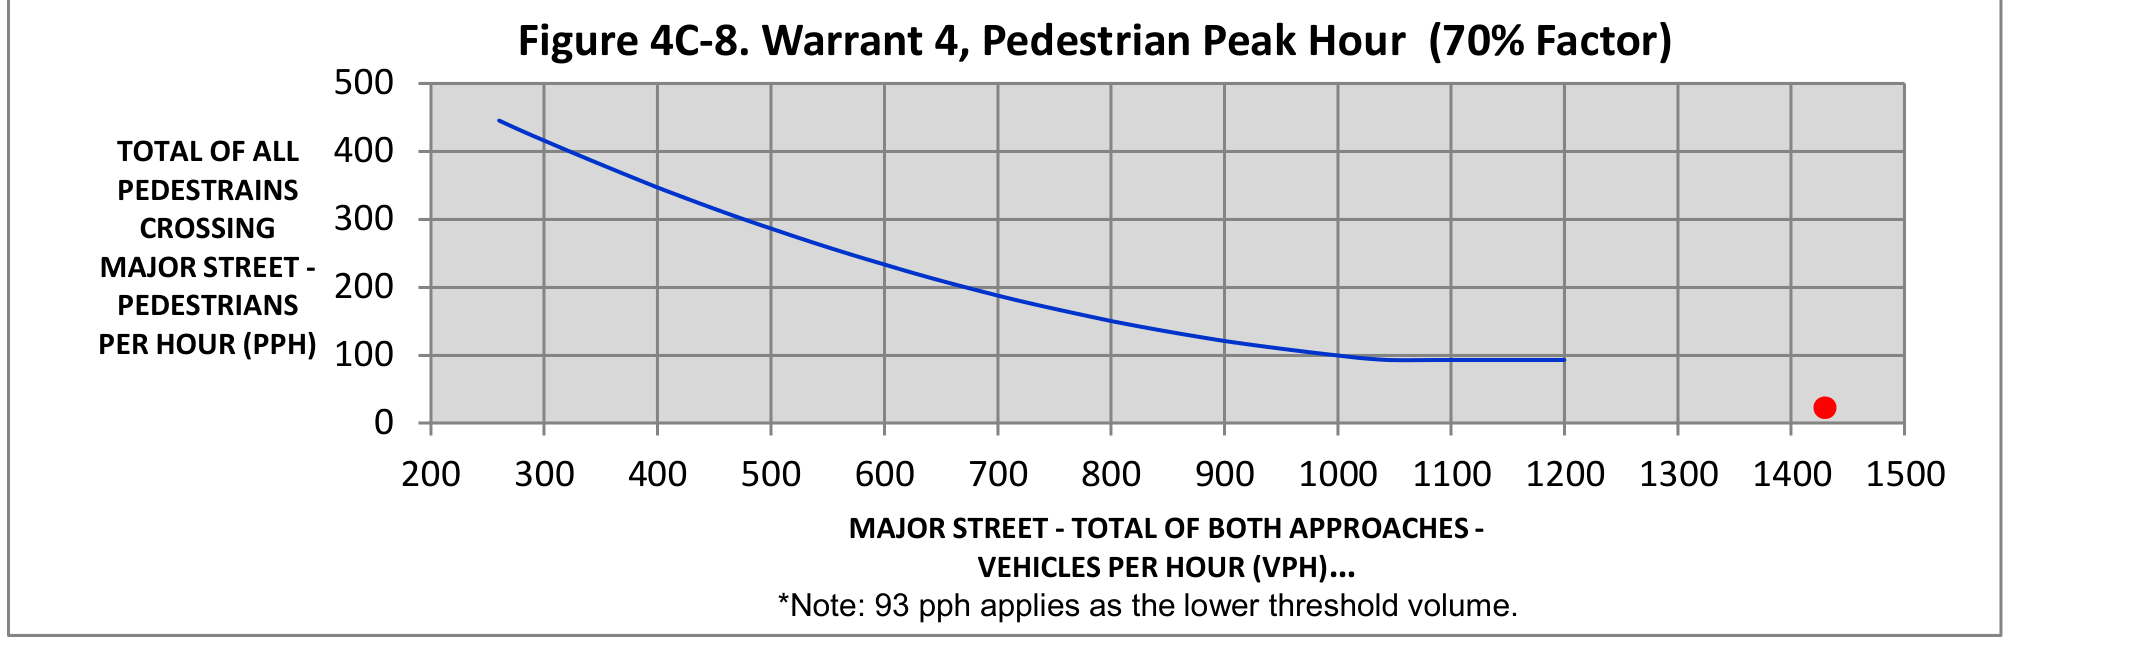
Chart image. On a narrow screen, scroll horizontally for a readable view or activate the image for a larger view. Expand the text equivalent for the chart labels and plotted data.
Text equivalent for Figure 4C-8
Axes: horizontal axis, “MAJOR STREET - TOTAL OF BOTH APPROACHES - VEHICLES PER HOUR (VPH)...,” from 200 to 1500 VPH; vertical axis, “TOTAL OF ALL PEDESTRIANS CROSSING MAJOR STREET - PEDESTRIANS PER HOUR (PPH),” from 0 to 500 PPH.
Blue threshold curve: begins near 445 PPH around 260 VPH, declines to about 93 PPH around 1050 VPH, and remains nearly level to about 1200 VPH. Red plotted point: one point near 1430 VPH and about 25 PPH. Note: 93 pph applies as the lower threshold volume.