Signal Warrant Schantz and Patterson
On narrow screens, use the chart viewer or open the full-size chart for readable labels.
Open full-size Figure 4C-5 chartChart description and plotted data
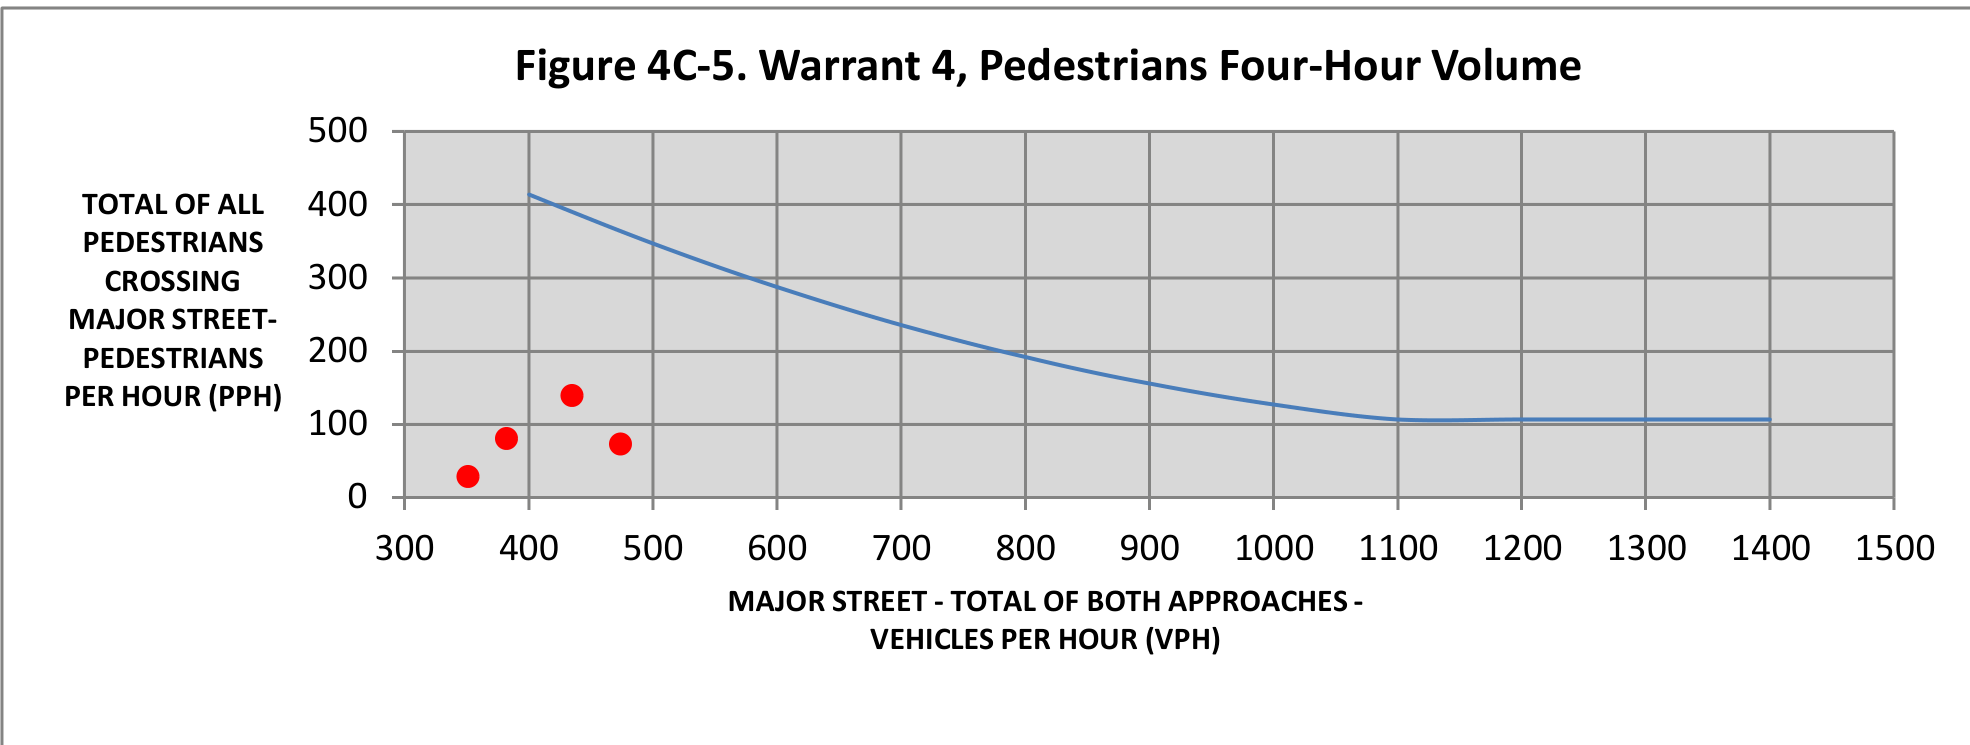
Figure 4C-5. Warrant 4, Pedestrians Four-Hour Volume.
Vertical axis: Total of all pedestrians crossing major street—pedestrians per hour (PPH). Horizontal axis: Major street—total of both approaches—vehicles per hour (VPH).
The source chart shows a blue warrant curve and four red plotted observations. Numeric labels for the individual red observations are not printed in the source chart.
On narrow screens, use the chart viewer or open the full-size chart for readable labels.
Open full-size Figure 4C-6 chartChart description and plotted data
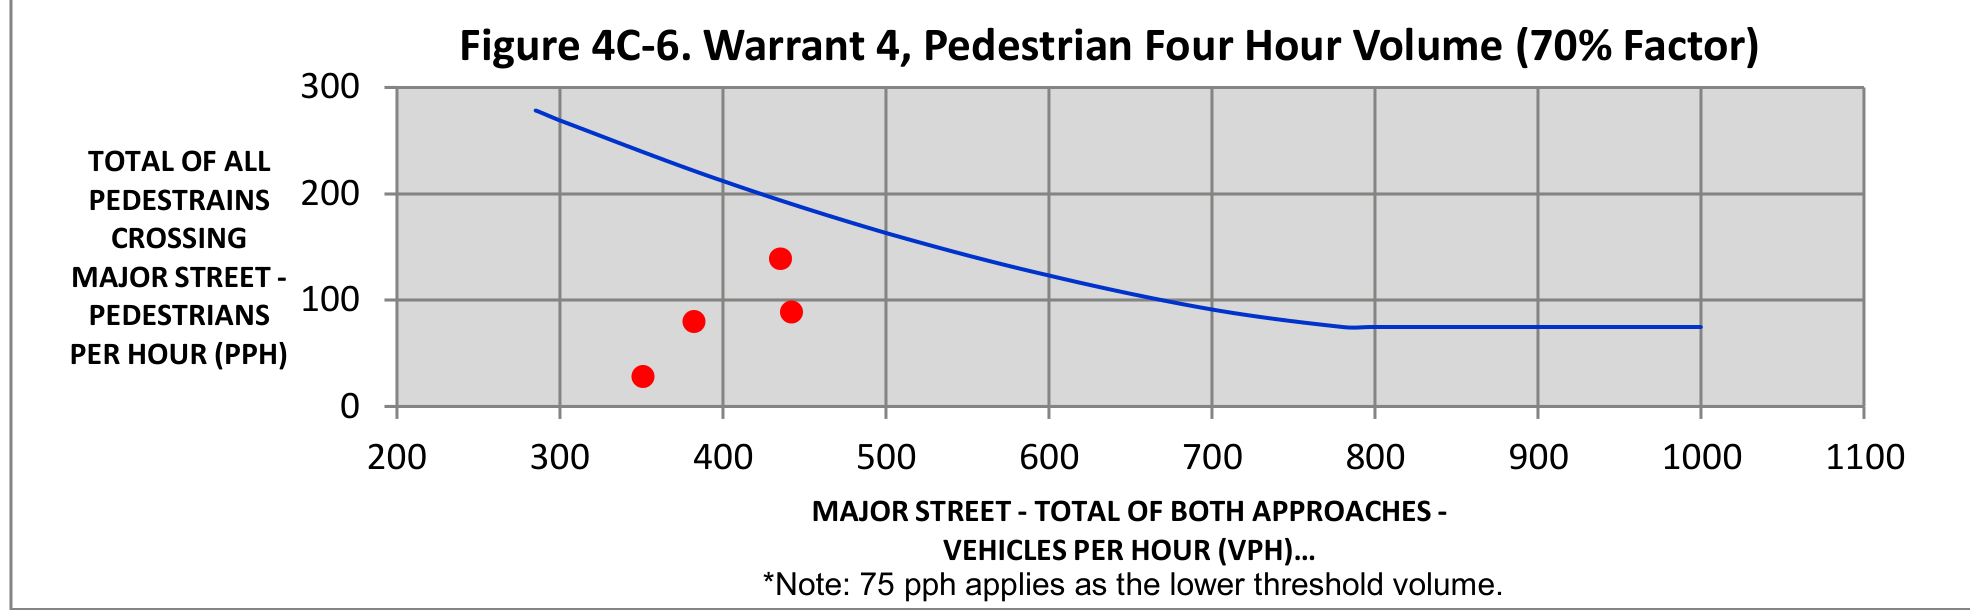
Figure 4C-6. Warrant 4, Pedestrian Four Hour Volume (70% Factor).
Vertical axis: Total of all pedestrians crossing major street—pedestrians per hour (PPH). Horizontal axis: Major street—total of both approaches—vehicles per hour (VPH).
Note: 75 pph applies as the lower threshold volume. The source chart shows a blue warrant curve and four red plotted observations; numeric labels for the individual red observations are not printed in the source chart.
On narrow screens, scroll horizontally to view the full chart at a readable size.
Chart description and plotted data
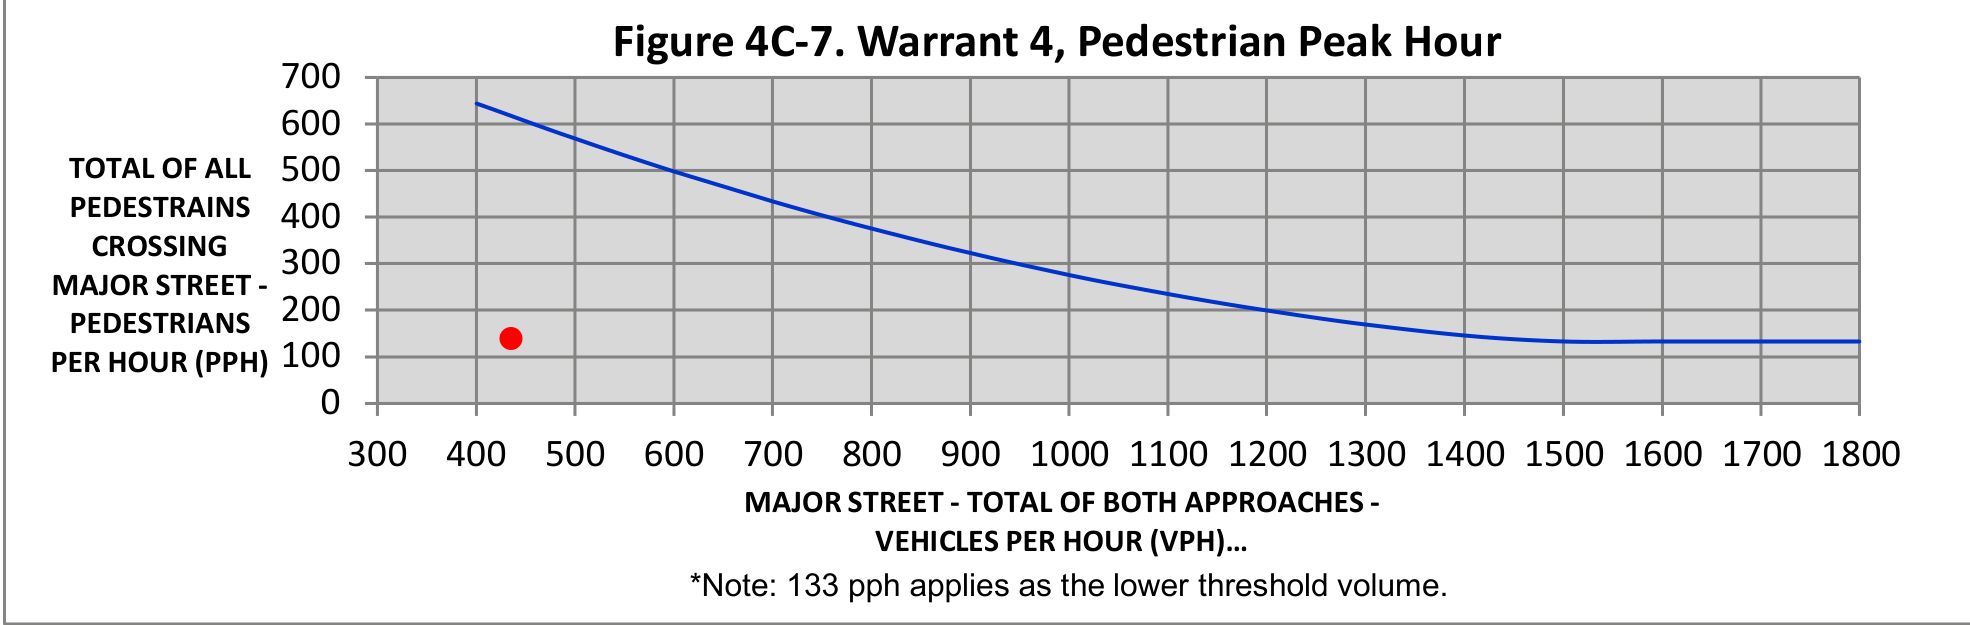
Figure 4C-7. Warrant 4, Pedestrian Peak Hour.
Vertical axis: Total of all pedestrians crossing major street—pedestrians per hour (PPH). Horizontal axis: Major street—total of both approaches—vehicles per hour (VPH).
Note: 133 pph applies as the lower threshold volume. The source chart shows a blue warrant curve and one red plotted observation; a numeric label for the individual red observation is not printed in the source chart.
On narrow screens, scroll horizontally to view the full chart at a readable size.
Chart description and plotted data
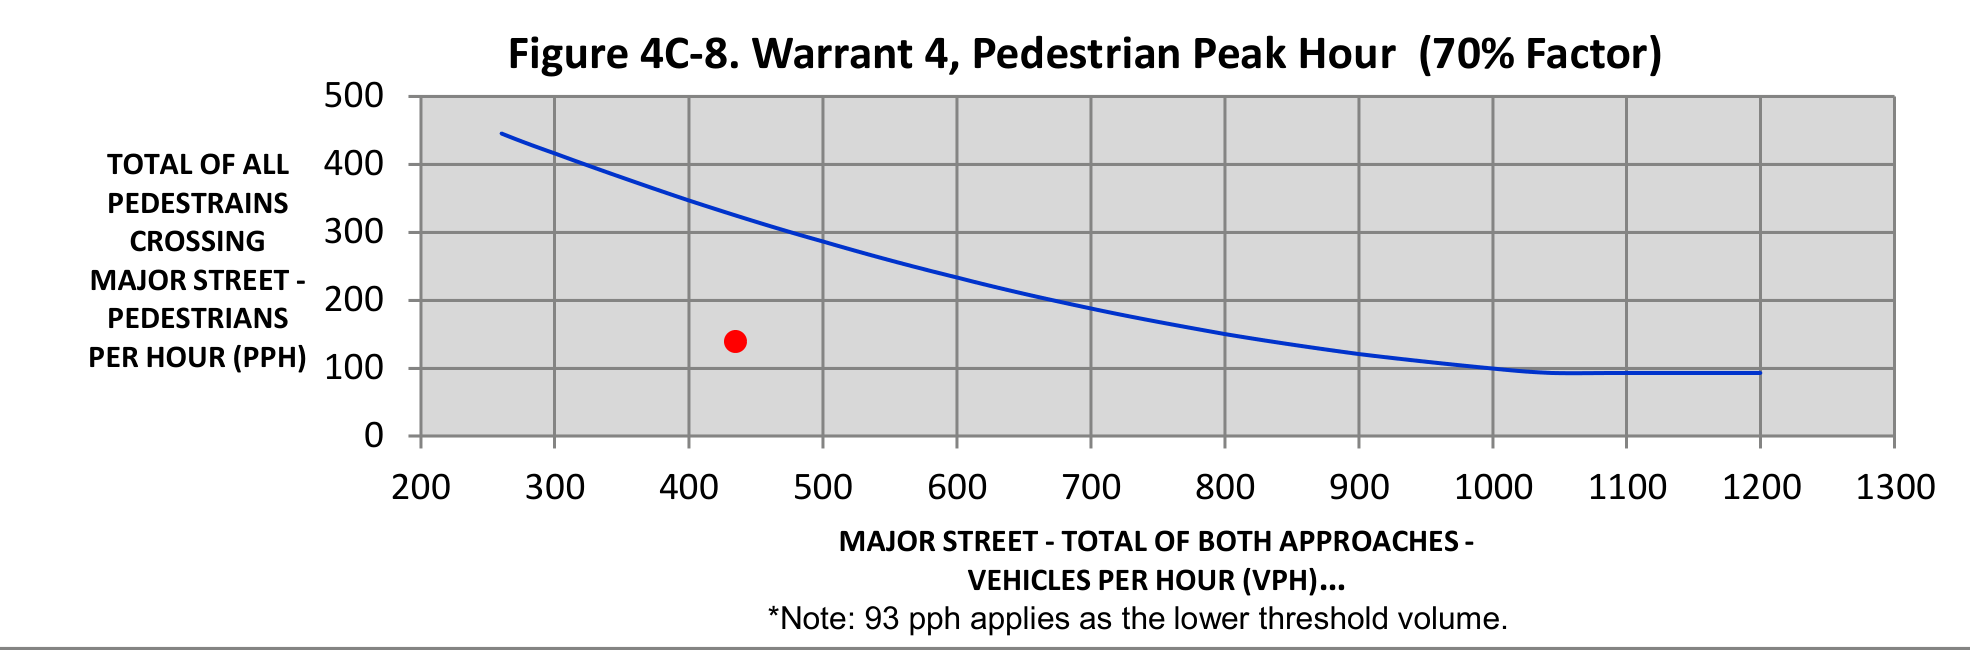
Figure 4C-8. Warrant 4, Pedestrian Peak Hour (70% Factor).
Vertical axis: Total of all pedestrians crossing major street—pedestrians per hour (PPH). Horizontal axis: Major street—total of both approaches—vehicles per hour (VPH).
Note: 93 pph applies as the lower threshold volume. The source chart shows a blue warrant curve and one red plotted observation; a numeric label for the individual red observation is not printed in the source chart.